South African vs Immigrants from Cabo Verde In Labor Force | Age 16-19
COMPARE
South African
Immigrants from Cabo Verde
In Labor Force | Age 16-19
In Labor Force | Age 16-19 Comparison
South Africans
Immigrants from Cabo Verde
36.7%
IN LABOR FORCE | AGE 16-19
58.3/ 100
METRIC RATING
172nd/ 347
METRIC RANK
44.7%
IN LABOR FORCE | AGE 16-19
100.0/ 100
METRIC RATING
8th/ 347
METRIC RANK
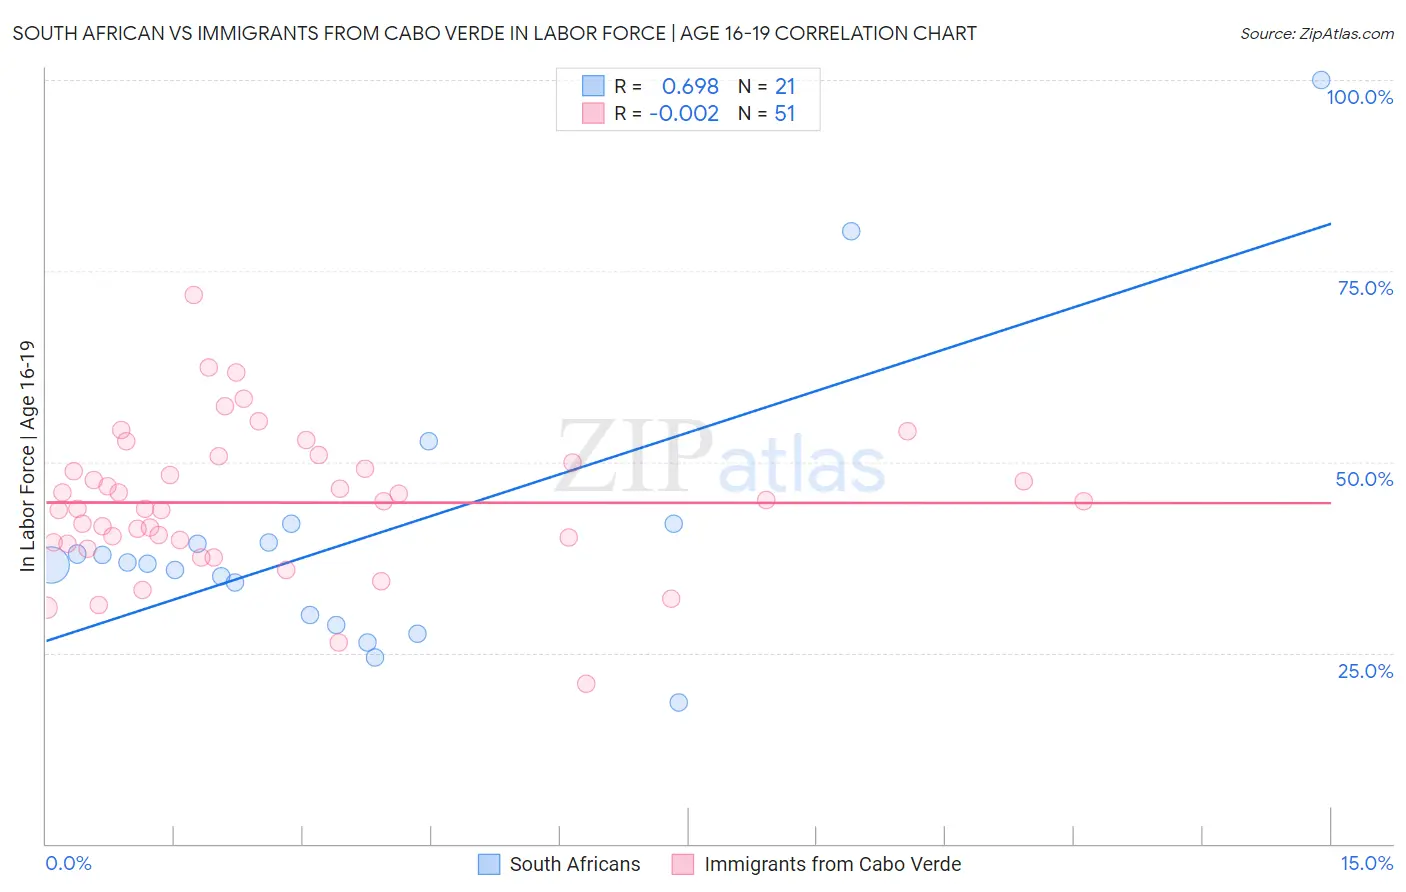
South African vs Immigrants from Cabo Verde In Labor Force | Age 16-19 Correlation Chart
The statistical analysis conducted on geographies consisting of 182,382,145 people shows a significant positive correlation between the proportion of South Africans and labor force participation rate among population between the ages 16 and 19 in the United States with a correlation coefficient (R) of 0.698 and weighted average of 36.7%. Similarly, the statistical analysis conducted on geographies consisting of 38,150,273 people shows no correlation between the proportion of Immigrants from Cabo Verde and labor force participation rate among population between the ages 16 and 19 in the United States with a correlation coefficient (R) of -0.002 and weighted average of 44.7%, a difference of 21.7%.
In Labor Force | Age 16-19 Correlation Summary
| Measurement | South African | Immigrants from Cabo Verde |
| Minimum | 18.5% | 21.0% |
| Maximum | 100.0% | 71.8% |
| Range | 81.5% | 50.8% |
| Mean | 40.1% | 44.7% |
| Median | 36.7% | 44.8% |
| Interquartile 25% (IQ1) | 29.3% | 39.5% |
| Interquartile 75% (IQ3) | 40.7% | 49.9% |
| Interquartile Range (IQR) | 11.4% | 10.4% |
| Standard Deviation (Sample) | 18.4% | 9.3% |
| Standard Deviation (Population) | 18.0% | 9.2% |
Similar Demographics by In Labor Force | Age 16-19
Demographics Similar to South Africans by In Labor Force | Age 16-19
In terms of in labor force | age 16-19, the demographic groups most similar to South Africans are Immigrants from Cambodia (36.7%, a difference of 0.010%), Russian (36.7%, a difference of 0.040%), Immigrants from South Africa (36.8%, a difference of 0.11%), Immigrants from Latvia (36.8%, a difference of 0.17%), and Palestinian (36.8%, a difference of 0.25%).
| Demographics | Rating | Rank | In Labor Force | Age 16-19 |
| Yakama | 66.9 /100 | #165 | Good 36.9% |
| Immigrants | Western Africa | 66.7 /100 | #166 | Good 36.9% |
| Arabs | 63.6 /100 | #167 | Good 36.8% |
| Palestinians | 63.1 /100 | #168 | Good 36.8% |
| Immigrants | Latvia | 61.6 /100 | #169 | Good 36.8% |
| Immigrants | South Africa | 60.5 /100 | #170 | Good 36.8% |
| Immigrants | Cambodia | 58.4 /100 | #171 | Average 36.7% |
| South Africans | 58.3 /100 | #172 | Average 36.7% |
| Russians | 57.5 /100 | #173 | Average 36.7% |
| Immigrants | Czechoslovakia | 50.0 /100 | #174 | Average 36.6% |
| Natives/Alaskans | 49.0 /100 | #175 | Average 36.6% |
| Albanians | 48.8 /100 | #176 | Average 36.5% |
| Immigrants | Northern Europe | 46.6 /100 | #177 | Average 36.5% |
| Blacks/African Americans | 45.1 /100 | #178 | Average 36.5% |
| Immigrants | Southern Europe | 43.3 /100 | #179 | Average 36.4% |
Demographics Similar to Immigrants from Cabo Verde by In Labor Force | Age 16-19
In terms of in labor force | age 16-19, the demographic groups most similar to Immigrants from Cabo Verde are Danish (44.7%, a difference of 0.040%), Cape Verdean (44.5%, a difference of 0.42%), Somali (45.1%, a difference of 0.99%), Alaskan Athabascan (45.2%, a difference of 1.2%), and German (44.2%, a difference of 1.2%).
| Demographics | Rating | Rank | In Labor Force | Age 16-19 |
| Pennsylvania Germans | 100.0 /100 | #1 | Exceptional 46.4% |
| Norwegians | 100.0 /100 | #2 | Exceptional 46.2% |
| Immigrants | Somalia | 100.0 /100 | #3 | Exceptional 45.6% |
| Luxembourgers | 100.0 /100 | #4 | Exceptional 45.3% |
| Alaskan Athabascans | 100.0 /100 | #5 | Exceptional 45.2% |
| Somalis | 100.0 /100 | #6 | Exceptional 45.1% |
| Danes | 100.0 /100 | #7 | Exceptional 44.7% |
| Immigrants | Cabo Verde | 100.0 /100 | #8 | Exceptional 44.7% |
| Cape Verdeans | 100.0 /100 | #9 | Exceptional 44.5% |
| Germans | 100.0 /100 | #10 | Exceptional 44.2% |
| Swedes | 100.0 /100 | #11 | Exceptional 44.1% |
| Finns | 100.0 /100 | #12 | Exceptional 43.9% |
| Dutch | 100.0 /100 | #13 | Exceptional 43.8% |
| Chippewa | 100.0 /100 | #14 | Exceptional 43.8% |
| Slovenes | 100.0 /100 | #15 | Exceptional 43.7% |