Hopi vs Immigrants from Cabo Verde In Labor Force | Age 16-19
COMPARE
Hopi
Immigrants from Cabo Verde
In Labor Force | Age 16-19
In Labor Force | Age 16-19 Comparison
Hopi
Immigrants from Cabo Verde
31.8%
IN LABOR FORCE | AGE 16-19
0.0/ 100
METRIC RATING
313th/ 347
METRIC RANK
44.7%
IN LABOR FORCE | AGE 16-19
100.0/ 100
METRIC RATING
8th/ 347
METRIC RANK
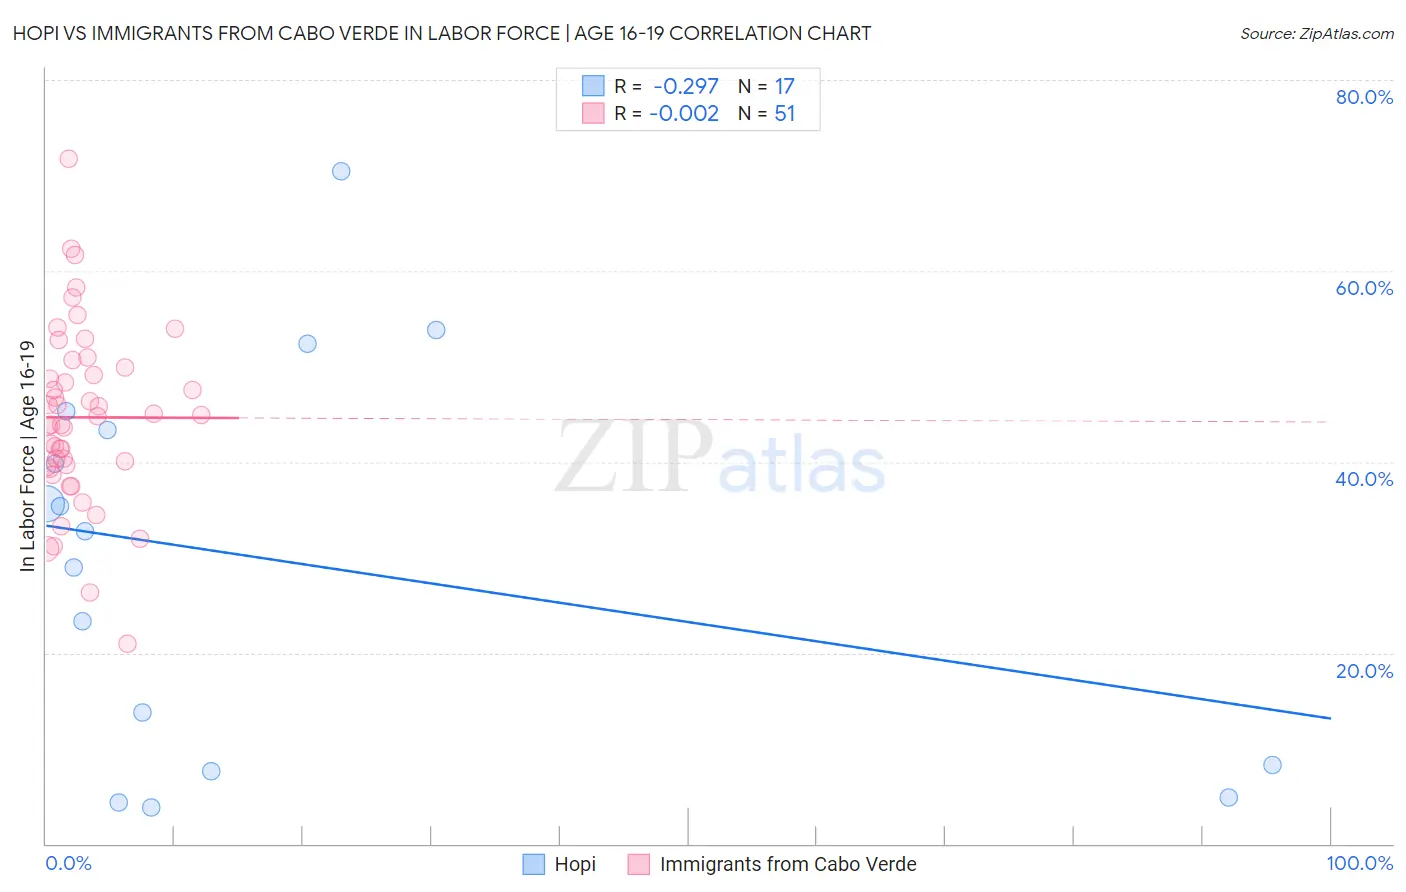
Hopi vs Immigrants from Cabo Verde In Labor Force | Age 16-19 Correlation Chart
The statistical analysis conducted on geographies consisting of 74,695,937 people shows a weak negative correlation between the proportion of Hopi and labor force participation rate among population between the ages 16 and 19 in the United States with a correlation coefficient (R) of -0.297 and weighted average of 31.8%. Similarly, the statistical analysis conducted on geographies consisting of 38,150,273 people shows no correlation between the proportion of Immigrants from Cabo Verde and labor force participation rate among population between the ages 16 and 19 in the United States with a correlation coefficient (R) of -0.002 and weighted average of 44.7%, a difference of 40.4%.
In Labor Force | Age 16-19 Correlation Summary
| Measurement | Hopi | Immigrants from Cabo Verde |
| Minimum | 3.8% | 21.0% |
| Maximum | 70.5% | 71.8% |
| Range | 66.7% | 50.8% |
| Mean | 29.6% | 44.7% |
| Median | 32.7% | 44.8% |
| Interquartile 25% (IQ1) | 7.9% | 39.5% |
| Interquartile 75% (IQ3) | 44.4% | 49.9% |
| Interquartile Range (IQR) | 36.5% | 10.4% |
| Standard Deviation (Sample) | 20.2% | 9.3% |
| Standard Deviation (Population) | 19.6% | 9.2% |
Similar Demographics by In Labor Force | Age 16-19
Demographics Similar to Hopi by In Labor Force | Age 16-19
In terms of in labor force | age 16-19, the demographic groups most similar to Hopi are Immigrants from Belize (31.8%, a difference of 0.010%), Indian (Asian) (31.9%, a difference of 0.15%), Cuban (31.8%, a difference of 0.16%), Immigrants from West Indies (31.7%, a difference of 0.34%), and Filipino (31.7%, a difference of 0.42%).
| Demographics | Rating | Rank | In Labor Force | Age 16-19 |
| Spanish American Indians | 0.0 /100 | #306 | Tragic 32.4% |
| Immigrants | Jamaica | 0.0 /100 | #307 | Tragic 32.2% |
| Navajo | 0.0 /100 | #308 | Tragic 32.1% |
| Immigrants | Eastern Asia | 0.0 /100 | #309 | Tragic 32.0% |
| Immigrants | Iran | 0.0 /100 | #310 | Tragic 32.0% |
| Indians (Asian) | 0.0 /100 | #311 | Tragic 31.9% |
| Immigrants | Belize | 0.0 /100 | #312 | Tragic 31.8% |
| Hopi | 0.0 /100 | #313 | Tragic 31.8% |
| Cubans | 0.0 /100 | #314 | Tragic 31.8% |
| Immigrants | West Indies | 0.0 /100 | #315 | Tragic 31.7% |
| Filipinos | 0.0 /100 | #316 | Tragic 31.7% |
| Immigrants | Nicaragua | 0.0 /100 | #317 | Tragic 31.6% |
| Immigrants | Yemen | 0.0 /100 | #318 | Tragic 31.5% |
| Soviet Union | 0.0 /100 | #319 | Tragic 31.4% |
| Ecuadorians | 0.0 /100 | #320 | Tragic 31.4% |
Demographics Similar to Immigrants from Cabo Verde by In Labor Force | Age 16-19
In terms of in labor force | age 16-19, the demographic groups most similar to Immigrants from Cabo Verde are Danish (44.7%, a difference of 0.040%), Cape Verdean (44.5%, a difference of 0.42%), Somali (45.1%, a difference of 0.99%), Alaskan Athabascan (45.2%, a difference of 1.2%), and German (44.2%, a difference of 1.2%).
| Demographics | Rating | Rank | In Labor Force | Age 16-19 |
| Pennsylvania Germans | 100.0 /100 | #1 | Exceptional 46.4% |
| Norwegians | 100.0 /100 | #2 | Exceptional 46.2% |
| Immigrants | Somalia | 100.0 /100 | #3 | Exceptional 45.6% |
| Luxembourgers | 100.0 /100 | #4 | Exceptional 45.3% |
| Alaskan Athabascans | 100.0 /100 | #5 | Exceptional 45.2% |
| Somalis | 100.0 /100 | #6 | Exceptional 45.1% |
| Danes | 100.0 /100 | #7 | Exceptional 44.7% |
| Immigrants | Cabo Verde | 100.0 /100 | #8 | Exceptional 44.7% |
| Cape Verdeans | 100.0 /100 | #9 | Exceptional 44.5% |
| Germans | 100.0 /100 | #10 | Exceptional 44.2% |
| Swedes | 100.0 /100 | #11 | Exceptional 44.1% |
| Finns | 100.0 /100 | #12 | Exceptional 43.9% |
| Dutch | 100.0 /100 | #13 | Exceptional 43.8% |
| Chippewa | 100.0 /100 | #14 | Exceptional 43.8% |
| Slovenes | 100.0 /100 | #15 | Exceptional 43.7% |