Slovene vs Brazilian In Labor Force | Age 25-29
COMPARE
Slovene
Brazilian
In Labor Force | Age 25-29
In Labor Force | Age 25-29 Comparison
Slovenes
Brazilians
86.4%
IN LABOR FORCE | AGE 25-29
100.0/ 100
METRIC RATING
6th/ 347
METRIC RANK
85.3%
IN LABOR FORCE | AGE 25-29
98.3/ 100
METRIC RATING
75th/ 347
METRIC RANK
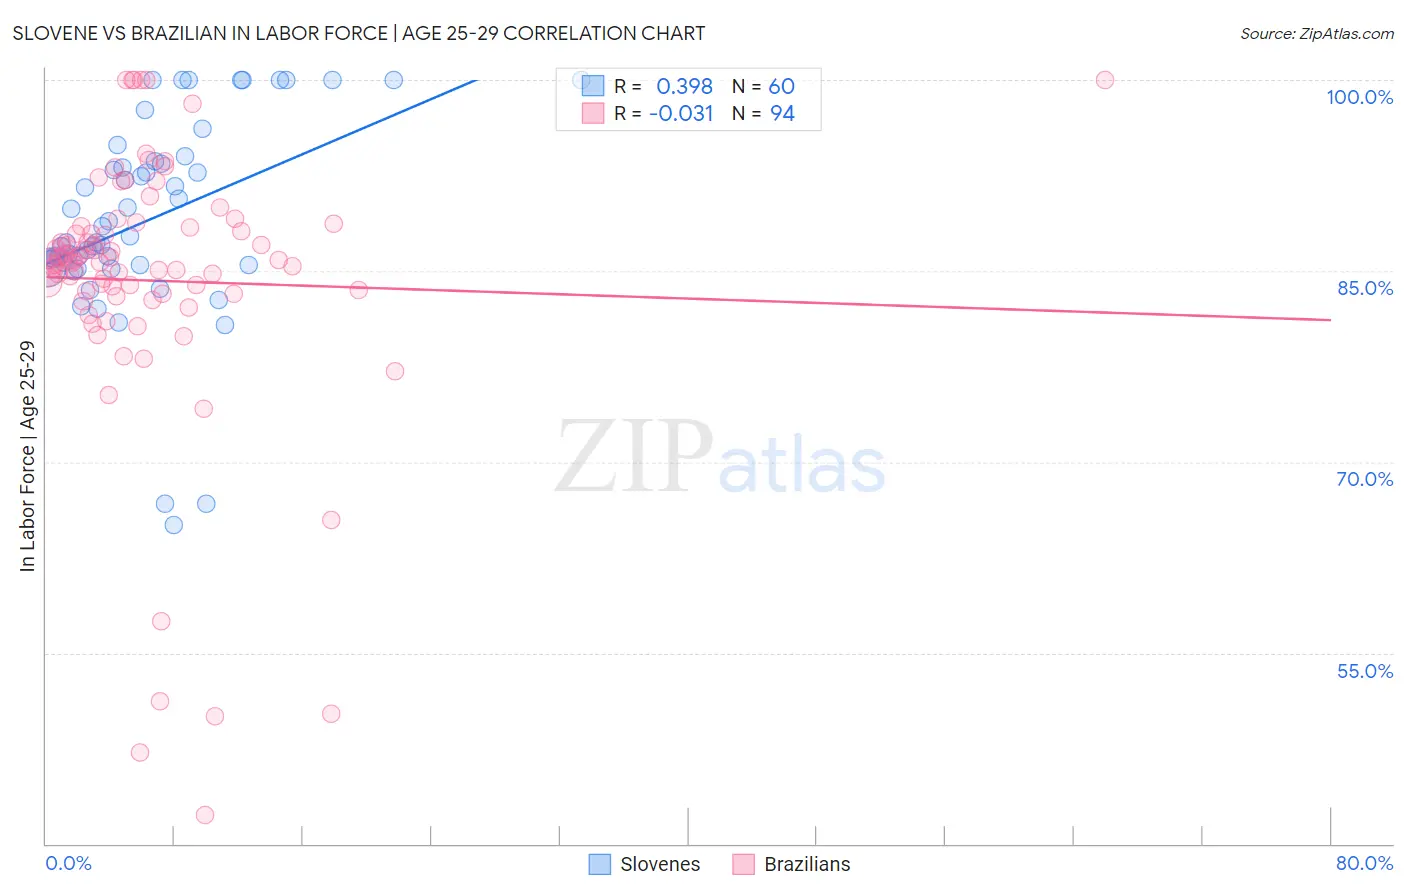
Slovene vs Brazilian In Labor Force | Age 25-29 Correlation Chart
The statistical analysis conducted on geographies consisting of 261,285,035 people shows a mild positive correlation between the proportion of Slovenes and labor force participation rate among population between the ages 25 and 29 in the United States with a correlation coefficient (R) of 0.398 and weighted average of 86.4%. Similarly, the statistical analysis conducted on geographies consisting of 323,871,107 people shows no correlation between the proportion of Brazilians and labor force participation rate among population between the ages 25 and 29 in the United States with a correlation coefficient (R) of -0.031 and weighted average of 85.3%, a difference of 1.3%.
In Labor Force | Age 25-29 Correlation Summary
| Measurement | Slovene | Brazilian |
| Minimum | 65.0% | 42.3% |
| Maximum | 100.0% | 100.0% |
| Range | 35.0% | 57.7% |
| Mean | 89.0% | 84.2% |
| Median | 87.5% | 85.8% |
| Interquartile 25% (IQ1) | 85.5% | 83.2% |
| Interquartile 75% (IQ3) | 93.5% | 88.4% |
| Interquartile Range (IQR) | 8.0% | 5.2% |
| Standard Deviation (Sample) | 7.8% | 10.8% |
| Standard Deviation (Population) | 7.8% | 10.7% |
Similar Demographics by In Labor Force | Age 25-29
Demographics Similar to Slovenes by In Labor Force | Age 25-29
In terms of in labor force | age 25-29, the demographic groups most similar to Slovenes are Immigrants from Bosnia and Herzegovina (86.3%, a difference of 0.12%), Immigrants from Cabo Verde (86.2%, a difference of 0.19%), Ethiopian (86.2%, a difference of 0.22%), Liberian (86.1%, a difference of 0.27%), and Immigrants from Ethiopia (86.1%, a difference of 0.27%).
| Demographics | Rating | Rank | In Labor Force | Age 25-29 |
| Tsimshian | 100.0 /100 | #1 | Exceptional 88.7% |
| Immigrants | Somalia | 100.0 /100 | #2 | Exceptional 87.1% |
| Somalis | 100.0 /100 | #3 | Exceptional 87.1% |
| Carpatho Rusyns | 100.0 /100 | #4 | Exceptional 87.0% |
| Luxembourgers | 100.0 /100 | #5 | Exceptional 86.9% |
| Slovenes | 100.0 /100 | #6 | Exceptional 86.4% |
| Immigrants | Bosnia and Herzegovina | 100.0 /100 | #7 | Exceptional 86.3% |
| Immigrants | Cabo Verde | 100.0 /100 | #8 | Exceptional 86.2% |
| Ethiopians | 100.0 /100 | #9 | Exceptional 86.2% |
| Liberians | 100.0 /100 | #10 | Exceptional 86.1% |
| Immigrants | Ethiopia | 100.0 /100 | #11 | Exceptional 86.1% |
| Immigrants | Lithuania | 100.0 /100 | #12 | Exceptional 86.1% |
| Norwegians | 100.0 /100 | #13 | Exceptional 86.1% |
| Latvians | 100.0 /100 | #14 | Exceptional 86.1% |
| Bolivians | 100.0 /100 | #15 | Exceptional 86.1% |
Demographics Similar to Brazilians by In Labor Force | Age 25-29
In terms of in labor force | age 25-29, the demographic groups most similar to Brazilians are German (85.3%, a difference of 0.020%), Soviet Union (85.3%, a difference of 0.030%), Immigrants from South Central Asia (85.2%, a difference of 0.040%), Immigrants from Egypt (85.2%, a difference of 0.060%), and Immigrants from Northern Africa (85.2%, a difference of 0.060%).
| Demographics | Rating | Rank | In Labor Force | Age 25-29 |
| Immigrants | Cameroon | 99.2 /100 | #68 | Exceptional 85.4% |
| Menominee | 99.1 /100 | #69 | Exceptional 85.4% |
| Immigrants | Sweden | 99.1 /100 | #70 | Exceptional 85.4% |
| Kenyans | 99.0 /100 | #71 | Exceptional 85.4% |
| Immigrants | Australia | 98.9 /100 | #72 | Exceptional 85.3% |
| Russians | 98.8 /100 | #73 | Exceptional 85.3% |
| Soviet Union | 98.5 /100 | #74 | Exceptional 85.3% |
| Brazilians | 98.3 /100 | #75 | Exceptional 85.3% |
| Germans | 98.1 /100 | #76 | Exceptional 85.3% |
| Immigrants | South Central Asia | 97.9 /100 | #77 | Exceptional 85.2% |
| Immigrants | Egypt | 97.7 /100 | #78 | Exceptional 85.2% |
| Immigrants | Northern Africa | 97.6 /100 | #79 | Exceptional 85.2% |
| Immigrants | Zimbabwe | 97.6 /100 | #80 | Exceptional 85.2% |
| Immigrants | Northern Europe | 97.2 /100 | #81 | Exceptional 85.2% |
| Okinawans | 97.0 /100 | #82 | Exceptional 85.2% |