Seminole vs Brazilian In Labor Force | Age 25-29
COMPARE
Seminole
Brazilian
In Labor Force | Age 25-29
In Labor Force | Age 25-29 Comparison
Seminole
Brazilians
81.7%
IN LABOR FORCE | AGE 25-29
0.0/ 100
METRIC RATING
319th/ 347
METRIC RANK
85.3%
IN LABOR FORCE | AGE 25-29
98.3/ 100
METRIC RATING
75th/ 347
METRIC RANK
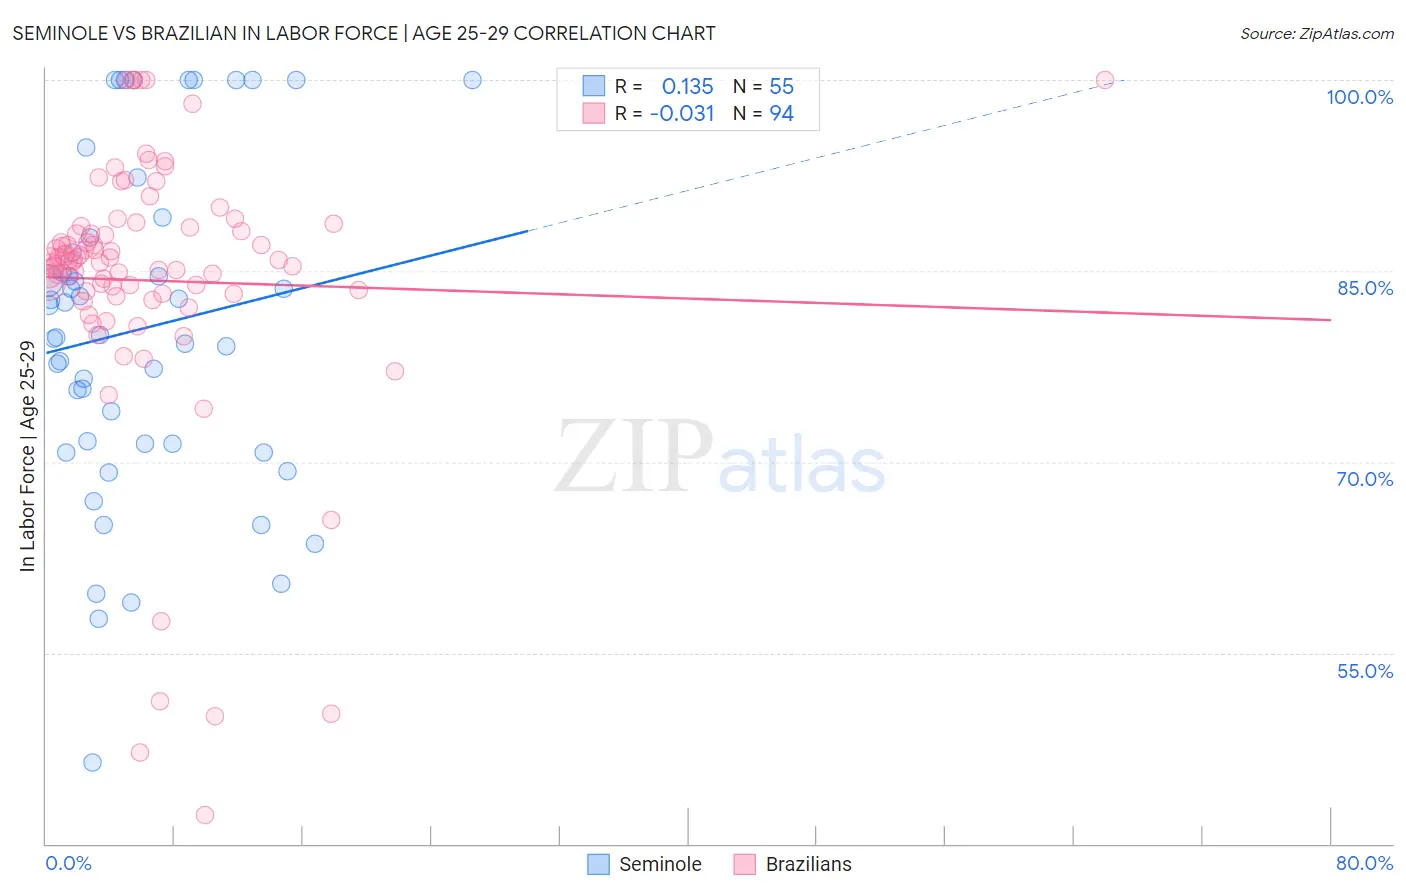
Seminole vs Brazilian In Labor Force | Age 25-29 Correlation Chart
The statistical analysis conducted on geographies consisting of 118,300,906 people shows a poor positive correlation between the proportion of Seminole and labor force participation rate among population between the ages 25 and 29 in the United States with a correlation coefficient (R) of 0.135 and weighted average of 81.7%. Similarly, the statistical analysis conducted on geographies consisting of 323,871,107 people shows no correlation between the proportion of Brazilians and labor force participation rate among population between the ages 25 and 29 in the United States with a correlation coefficient (R) of -0.031 and weighted average of 85.3%, a difference of 4.4%.
In Labor Force | Age 25-29 Correlation Summary
| Measurement | Seminole | Brazilian |
| Minimum | 46.3% | 42.3% |
| Maximum | 100.0% | 100.0% |
| Range | 53.7% | 57.7% |
| Mean | 80.4% | 84.2% |
| Median | 80.0% | 85.8% |
| Interquartile 25% (IQ1) | 71.4% | 83.2% |
| Interquartile 75% (IQ3) | 87.6% | 88.4% |
| Interquartile Range (IQR) | 16.2% | 5.2% |
| Standard Deviation (Sample) | 13.0% | 10.8% |
| Standard Deviation (Population) | 12.9% | 10.7% |
Similar Demographics by In Labor Force | Age 25-29
Demographics Similar to Seminole by In Labor Force | Age 25-29
In terms of in labor force | age 25-29, the demographic groups most similar to Seminole are Colville (81.6%, a difference of 0.050%), Shoshone (81.6%, a difference of 0.11%), Kiowa (81.6%, a difference of 0.12%), Alaska Native (81.6%, a difference of 0.16%), and Comanche (81.9%, a difference of 0.22%).
| Demographics | Rating | Rank | In Labor Force | Age 25-29 |
| Hispanics or Latinos | 0.0 /100 | #312 | Tragic 82.2% |
| Yaqui | 0.0 /100 | #313 | Tragic 82.2% |
| Cherokee | 0.0 /100 | #314 | Tragic 82.1% |
| Immigrants | Mexico | 0.0 /100 | #315 | Tragic 82.0% |
| Mexicans | 0.0 /100 | #316 | Tragic 81.9% |
| Chickasaw | 0.0 /100 | #317 | Tragic 81.9% |
| Comanche | 0.0 /100 | #318 | Tragic 81.9% |
| Seminole | 0.0 /100 | #319 | Tragic 81.7% |
| Colville | 0.0 /100 | #320 | Tragic 81.6% |
| Shoshone | 0.0 /100 | #321 | Tragic 81.6% |
| Kiowa | 0.0 /100 | #322 | Tragic 81.6% |
| Alaska Natives | 0.0 /100 | #323 | Tragic 81.6% |
| Houma | 0.0 /100 | #324 | Tragic 81.2% |
| Dutch West Indians | 0.0 /100 | #325 | Tragic 81.1% |
| Choctaw | 0.0 /100 | #326 | Tragic 81.0% |
Demographics Similar to Brazilians by In Labor Force | Age 25-29
In terms of in labor force | age 25-29, the demographic groups most similar to Brazilians are German (85.3%, a difference of 0.020%), Soviet Union (85.3%, a difference of 0.030%), Immigrants from South Central Asia (85.2%, a difference of 0.040%), Immigrants from Egypt (85.2%, a difference of 0.060%), and Immigrants from Northern Africa (85.2%, a difference of 0.060%).
| Demographics | Rating | Rank | In Labor Force | Age 25-29 |
| Immigrants | Cameroon | 99.2 /100 | #68 | Exceptional 85.4% |
| Menominee | 99.1 /100 | #69 | Exceptional 85.4% |
| Immigrants | Sweden | 99.1 /100 | #70 | Exceptional 85.4% |
| Kenyans | 99.0 /100 | #71 | Exceptional 85.4% |
| Immigrants | Australia | 98.9 /100 | #72 | Exceptional 85.3% |
| Russians | 98.8 /100 | #73 | Exceptional 85.3% |
| Soviet Union | 98.5 /100 | #74 | Exceptional 85.3% |
| Brazilians | 98.3 /100 | #75 | Exceptional 85.3% |
| Germans | 98.1 /100 | #76 | Exceptional 85.3% |
| Immigrants | South Central Asia | 97.9 /100 | #77 | Exceptional 85.2% |
| Immigrants | Egypt | 97.7 /100 | #78 | Exceptional 85.2% |
| Immigrants | Northern Africa | 97.6 /100 | #79 | Exceptional 85.2% |
| Immigrants | Zimbabwe | 97.6 /100 | #80 | Exceptional 85.2% |
| Immigrants | Northern Europe | 97.2 /100 | #81 | Exceptional 85.2% |
| Okinawans | 97.0 /100 | #82 | Exceptional 85.2% |