Ottawa vs Cherokee In Labor Force | Age 25-29
COMPARE
Ottawa
Cherokee
In Labor Force | Age 25-29
In Labor Force | Age 25-29 Comparison
Ottawa
Cherokee
83.0%
IN LABOR FORCE | AGE 25-29
0.0/ 100
METRIC RATING
288th/ 347
METRIC RANK
82.1%
IN LABOR FORCE | AGE 25-29
0.0/ 100
METRIC RATING
314th/ 347
METRIC RANK
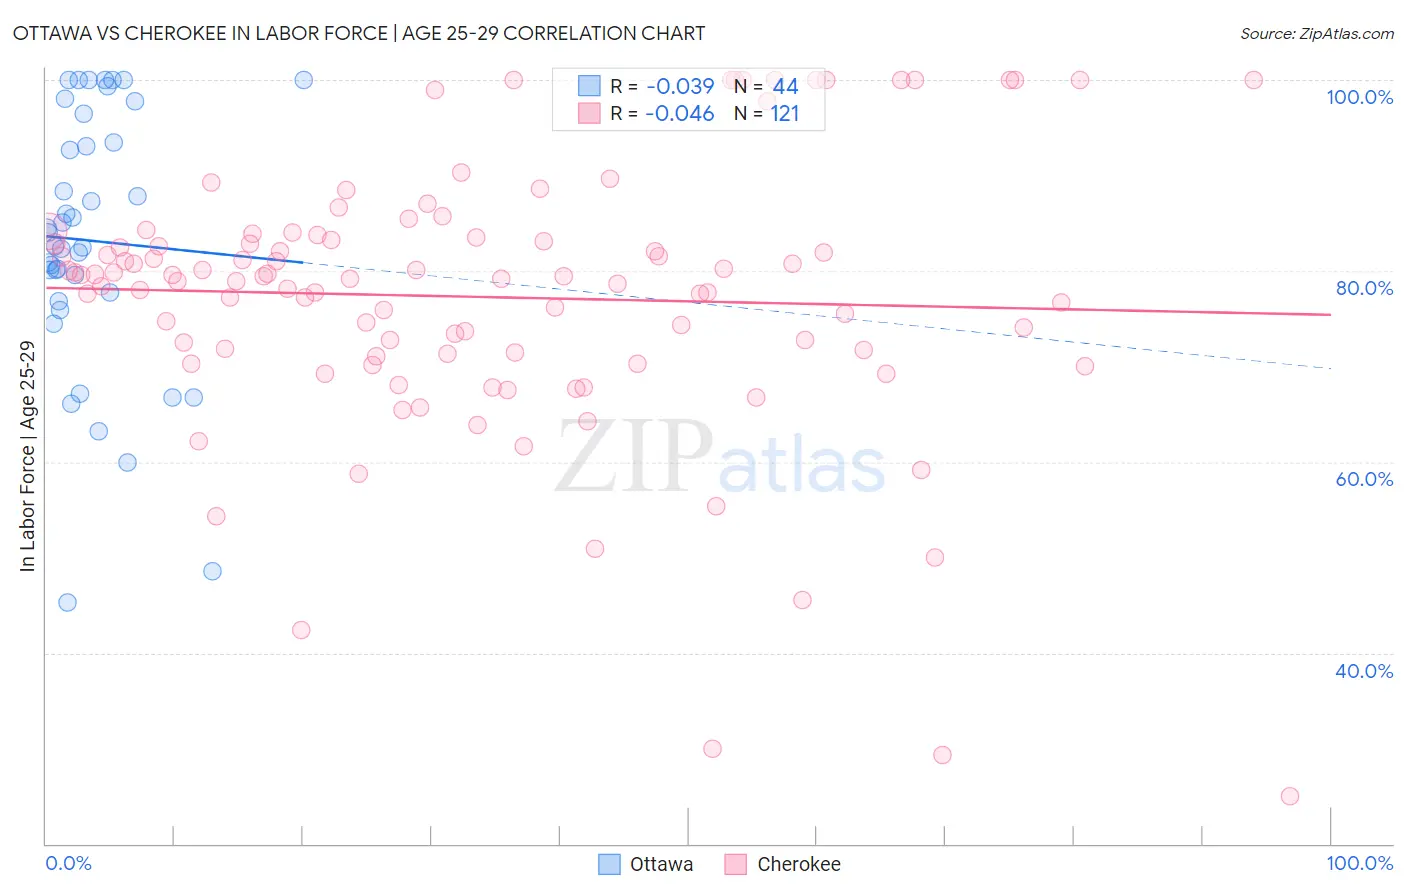
Ottawa vs Cherokee In Labor Force | Age 25-29 Correlation Chart
The statistical analysis conducted on geographies consisting of 49,951,739 people shows no correlation between the proportion of Ottawa and labor force participation rate among population between the ages 25 and 29 in the United States with a correlation coefficient (R) of -0.039 and weighted average of 83.0%. Similarly, the statistical analysis conducted on geographies consisting of 493,231,210 people shows no correlation between the proportion of Cherokee and labor force participation rate among population between the ages 25 and 29 in the United States with a correlation coefficient (R) of -0.046 and weighted average of 82.1%, a difference of 1.1%.
In Labor Force | Age 25-29 Correlation Summary
| Measurement | Ottawa | Cherokee |
| Minimum | 45.3% | 25.0% |
| Maximum | 100.0% | 100.0% |
| Range | 54.7% | 75.0% |
| Mean | 83.2% | 77.3% |
| Median | 83.3% | 79.1% |
| Interquartile 25% (IQ1) | 77.3% | 71.2% |
| Interquartile 75% (IQ3) | 95.0% | 83.4% |
| Interquartile Range (IQR) | 17.7% | 12.2% |
| Standard Deviation (Sample) | 13.8% | 14.2% |
| Standard Deviation (Population) | 13.6% | 14.2% |
Similar Demographics by In Labor Force | Age 25-29
Demographics Similar to Ottawa by In Labor Force | Age 25-29
In terms of in labor force | age 25-29, the demographic groups most similar to Ottawa are Immigrants from Micronesia (83.0%, a difference of 0.020%), Guyanese (83.0%, a difference of 0.030%), Mexican American Indian (83.0%, a difference of 0.040%), Immigrants from Bangladesh (83.0%, a difference of 0.050%), and Belizean (83.1%, a difference of 0.060%).
| Demographics | Rating | Rank | In Labor Force | Age 25-29 |
| Immigrants | Dominican Republic | 0.0 /100 | #281 | Tragic 83.1% |
| Americans | 0.0 /100 | #282 | Tragic 83.1% |
| Immigrants | Azores | 0.0 /100 | #283 | Tragic 83.1% |
| Nicaraguans | 0.0 /100 | #284 | Tragic 83.1% |
| Belizeans | 0.0 /100 | #285 | Tragic 83.1% |
| Mexican American Indians | 0.0 /100 | #286 | Tragic 83.0% |
| Guyanese | 0.0 /100 | #287 | Tragic 83.0% |
| Ottawa | 0.0 /100 | #288 | Tragic 83.0% |
| Immigrants | Micronesia | 0.0 /100 | #289 | Tragic 83.0% |
| Immigrants | Bangladesh | 0.0 /100 | #290 | Tragic 83.0% |
| Hawaiians | 0.0 /100 | #291 | Tragic 83.0% |
| Immigrants | Guyana | 0.0 /100 | #292 | Tragic 83.0% |
| Immigrants | Latin America | 0.0 /100 | #293 | Tragic 82.9% |
| Nepalese | 0.0 /100 | #294 | Tragic 82.9% |
| Chippewa | 0.0 /100 | #295 | Tragic 82.9% |
Demographics Similar to Cherokee by In Labor Force | Age 25-29
In terms of in labor force | age 25-29, the demographic groups most similar to Cherokee are Yaqui (82.2%, a difference of 0.050%), Immigrants from Mexico (82.0%, a difference of 0.13%), Hispanic or Latino (82.2%, a difference of 0.14%), Alaskan Athabascan (82.3%, a difference of 0.21%), and Osage (82.3%, a difference of 0.22%).
| Demographics | Rating | Rank | In Labor Force | Age 25-29 |
| Cajuns | 0.0 /100 | #307 | Tragic 82.5% |
| Central American Indians | 0.0 /100 | #308 | Tragic 82.4% |
| Immigrants | Central America | 0.0 /100 | #309 | Tragic 82.4% |
| Osage | 0.0 /100 | #310 | Tragic 82.3% |
| Alaskan Athabascans | 0.0 /100 | #311 | Tragic 82.3% |
| Hispanics or Latinos | 0.0 /100 | #312 | Tragic 82.2% |
| Yaqui | 0.0 /100 | #313 | Tragic 82.2% |
| Cherokee | 0.0 /100 | #314 | Tragic 82.1% |
| Immigrants | Mexico | 0.0 /100 | #315 | Tragic 82.0% |
| Mexicans | 0.0 /100 | #316 | Tragic 81.9% |
| Chickasaw | 0.0 /100 | #317 | Tragic 81.9% |
| Comanche | 0.0 /100 | #318 | Tragic 81.9% |
| Seminole | 0.0 /100 | #319 | Tragic 81.7% |
| Colville | 0.0 /100 | #320 | Tragic 81.6% |
| Shoshone | 0.0 /100 | #321 | Tragic 81.6% |