Moroccan vs Icelander In Labor Force | Age > 16

COMPARE

Moroccan
Race
Ancestry
AfghanAfricanAlaska NativeAlaskan AthabascanAlbanianAleutAlsatianAmericanApacheArabArapahoArgentineanArmenianAssyrian/Chaldean/SyriacAustralianAustrianBahamianBangladeshiBarbadianBasqueBelgianBelizeanBermudanBhutaneseBlackfeetBolivianBrazilianBritishBritish West IndianBulgarianBurmeseCajunCambodianCanadianCape VerdeanCarpatho RusynCelticCentral AmericanCentral American IndianCherokeeCheyenneChickasawChileanChineseChippewaChoctawColombianColvilleComancheCosta RicanCreeCreekCroatianCrowCubanCypriotCzechCzechoslovakianDanishDelawareDominicanDutchDutch West IndianEastern EuropeanEcuadorianEgyptianEnglishEstonianEthiopianEuropeanFijianFilipinoFinnishFrenchFrench American IndianFrench CanadianGermanGerman RussianGhanaianGreekGuamanian/ChamorroGuatemalanGuyaneseHaitianHmongHonduranHopiHoumaHungarianIndian (Asian)IndonesianInupiatIranianIraqiIrishIroquoisIsraeliItalianJamaicanJapaneseJordanianKenyanKiowaKoreanLaotianLatvianLebaneseLiberianLithuanianLumbeeLuxembourgerMacedonianMalaysianMalteseMarshalleseMenomineeMexicanMexican American IndianMongolianMoroccanNative HawaiianNavajoNepaleseNew ZealanderNicaraguanNigerianNorthern EuropeanNorwegianOkinawanOsageOttawaPaiutePakistaniPalestinianPanamanianParaguayanPennsylvania GermanPeruvianPimaPolishPortuguesePotawatomiPuebloPuerto RicanPuget Sound SalishRomanianRussianSalvadoranSamoanScandinavianScotch-IrishScottishSeminoleSenegaleseSerbianShoshoneSierra LeoneanSiouxSlavicSlovakSloveneSomaliSouth AfricanSouth AmericanSouth American IndianSoviet UnionSpaniardSpanishSpanish AmericanSpanish American IndianSri LankanSubsaharan AfricanSudaneseSwedishSwissSyrianTaiwaneseThaiTlingit-HaidaTohono O'OdhamTonganTrinidadian and TobagonianTsimshianTurkishU.S. Virgin IslanderUgandanUkrainianUruguayanUteVenezuelanVietnameseWelshWest IndianYakamaYaquiYugoslavianYumanYup'ikZimbabwean
Immigration
NonimmigrantsImmigrantsAfghanistanAfricaAlbaniaArgentinaArmeniaAsiaAustraliaAustriaBahamasBangladeshBarbadosBelarusBelgiumBelizeBoliviaBosnia and HerzegovinaBrazilBulgariaBurma/MyanmarCabo VerdeCambodiaCameroonCanadaCaribbeanCentral AmericaChileChinaColombiaCongoCosta RicaCroatiaCubaCzechoslovakiaDenmarkDominicaDominican RepublicEastern AfricaEastern AsiaEastern EuropeEcuadorEgyptEl SalvadorEnglandEritreaEthiopiaEuropeFijiFranceGermanyGhanaGreeceGrenadaGuatemalaGuyanaHaitiHondurasHong KongHungaryIndiaIndonesiaIranIraqIrelandIsraelItalyJamaicaJapanJordanKazakhstanKenyaKoreaKuwaitLaosLatin AmericaLatviaLebanonLiberiaLithuaniaMalaysiaMexicoMicronesiaMiddle AfricaMoldovaMoroccoNepalNetherlandsNicaraguaNigeriaNorth AmericaNorth MacedoniaNorthern AfricaNorthern EuropeNorwayOceaniaPakistanPanamaPeruPhilippinesPolandPortugalRomaniaRussiaSaudi ArabiaScotlandSenegalSerbiaSierra LeoneSingaporeSomaliaSouth AfricaSouth AmericaSouth Central AsiaSouth Eastern AsiaSouthern EuropeSpainSri LankaSt. Vincent and the GrenadinesSudanSwedenSwitzerlandSyriaTaiwanThailandTrinidad and TobagoTurkeyUgandaUkraineUruguayUzbekistanVenezuelaVietnamWest IndiesWestern AfricaWestern AsiaWestern EuropeYemenZaireZimbabweAzores
Icelander
Race
Ancestry
AfghanAfricanAlaska NativeAlaskan AthabascanAlbanianAleutAlsatianAmericanApacheArabArapahoArgentineanArmenianAssyrian/Chaldean/SyriacAustralianAustrianBahamianBangladeshiBarbadianBasqueBelgianBelizeanBermudanBhutaneseBlackfeetBolivianBrazilianBritishBritish West IndianBulgarianBurmeseCajunCambodianCanadianCape VerdeanCarpatho RusynCelticCentral AmericanCentral American IndianCherokeeCheyenneChickasawChileanChineseChippewaChoctawColombianColvilleComancheCosta RicanCreeCreekCroatianCrowCubanCypriotCzechCzechoslovakianDanishDelawareDominicanDutchDutch West IndianEastern EuropeanEcuadorianEgyptianEnglishEstonianEthiopianEuropeanFijianFilipinoFinnishFrenchFrench American IndianFrench CanadianGermanGerman RussianGhanaianGreekGuamanian/ChamorroGuatemalanGuyaneseHaitianHmongHonduranHopiHoumaHungarianIcelanderIndian (Asian)IndonesianInupiatIranianIraqiIrishIroquoisIsraeliItalianJamaicanJapaneseJordanianKenyanKiowaKoreanLaotianLatvianLebaneseLiberianLithuanianLumbeeLuxembourgerMacedonianMalaysianMalteseMarshalleseMenomineeMexicanMexican American IndianMongolianNative HawaiianNavajoNepaleseNew ZealanderNicaraguanNigerianNorthern EuropeanNorwegianOkinawanOsageOttawaPaiutePakistaniPalestinianPanamanianParaguayanPennsylvania GermanPeruvianPimaPolishPortuguesePotawatomiPuebloPuerto RicanPuget Sound SalishRomanianRussianSalvadoranSamoanScandinavianScotch-IrishScottishSeminoleSenegaleseSerbianShoshoneSierra LeoneanSiouxSlavicSlovakSloveneSomaliSouth AfricanSouth AmericanSouth American IndianSoviet UnionSpaniardSpanishSpanish AmericanSpanish American IndianSri LankanSubsaharan AfricanSudaneseSwedishSwissSyrianTaiwaneseThaiTlingit-HaidaTohono O'OdhamTonganTrinidadian and TobagonianTsimshianTurkishU.S. Virgin IslanderUgandanUkrainianUruguayanUteVenezuelanVietnameseWelshWest IndianYakamaYaquiYugoslavianYumanYup'ikZimbabwean
Immigration
NonimmigrantsImmigrantsAfghanistanAfricaAlbaniaArgentinaArmeniaAsiaAustraliaAustriaBahamasBangladeshBarbadosBelarusBelgiumBelizeBoliviaBosnia and HerzegovinaBrazilBulgariaBurma/MyanmarCabo VerdeCambodiaCameroonCanadaCaribbeanCentral AmericaChileChinaColombiaCongoCosta RicaCroatiaCubaCzechoslovakiaDenmarkDominicaDominican RepublicEastern AfricaEastern AsiaEastern EuropeEcuadorEgyptEl SalvadorEnglandEritreaEthiopiaEuropeFijiFranceGermanyGhanaGreeceGrenadaGuatemalaGuyanaHaitiHondurasHong KongHungaryIndiaIndonesiaIranIraqIrelandIsraelItalyJamaicaJapanJordanKazakhstanKenyaKoreaKuwaitLaosLatin AmericaLatviaLebanonLiberiaLithuaniaMalaysiaMexicoMicronesiaMiddle AfricaMoldovaMoroccoNepalNetherlandsNicaraguaNigeriaNorth AmericaNorth MacedoniaNorthern AfricaNorthern EuropeNorwayOceaniaPakistanPanamaPeruPhilippinesPolandPortugalRomaniaRussiaSaudi ArabiaScotlandSenegalSerbiaSierra LeoneSingaporeSomaliaSouth AfricaSouth AmericaSouth Central AsiaSouth Eastern AsiaSouthern EuropeSpainSri LankaSt. Vincent and the GrenadinesSudanSwedenSwitzerlandSyriaTaiwanThailandTrinidad and TobagoTurkeyUgandaUkraineUruguayUzbekistanVenezuelaVietnamWest IndiesWestern AfricaWestern AsiaWestern EuropeYemenZaireZimbabweAzores
In Labor Force | Age > 16
Income
Poverty
Unemployment
Labor Participation
Family Structure
Vehicle Availability
Education Level
Disability

In Labor Force | Age > 16 Comparison

Moroccans

Icelanders

Exceptional
Exceptional
66.1%
IN LABOR FORCE | AGE > 16
99.5/ 100
METRIC RATING
81st/ 347
METRIC RANK
65.6%
IN LABOR FORCE | AGE > 16
94.3/ 100
METRIC RATING
131st/ 347
METRIC RANK

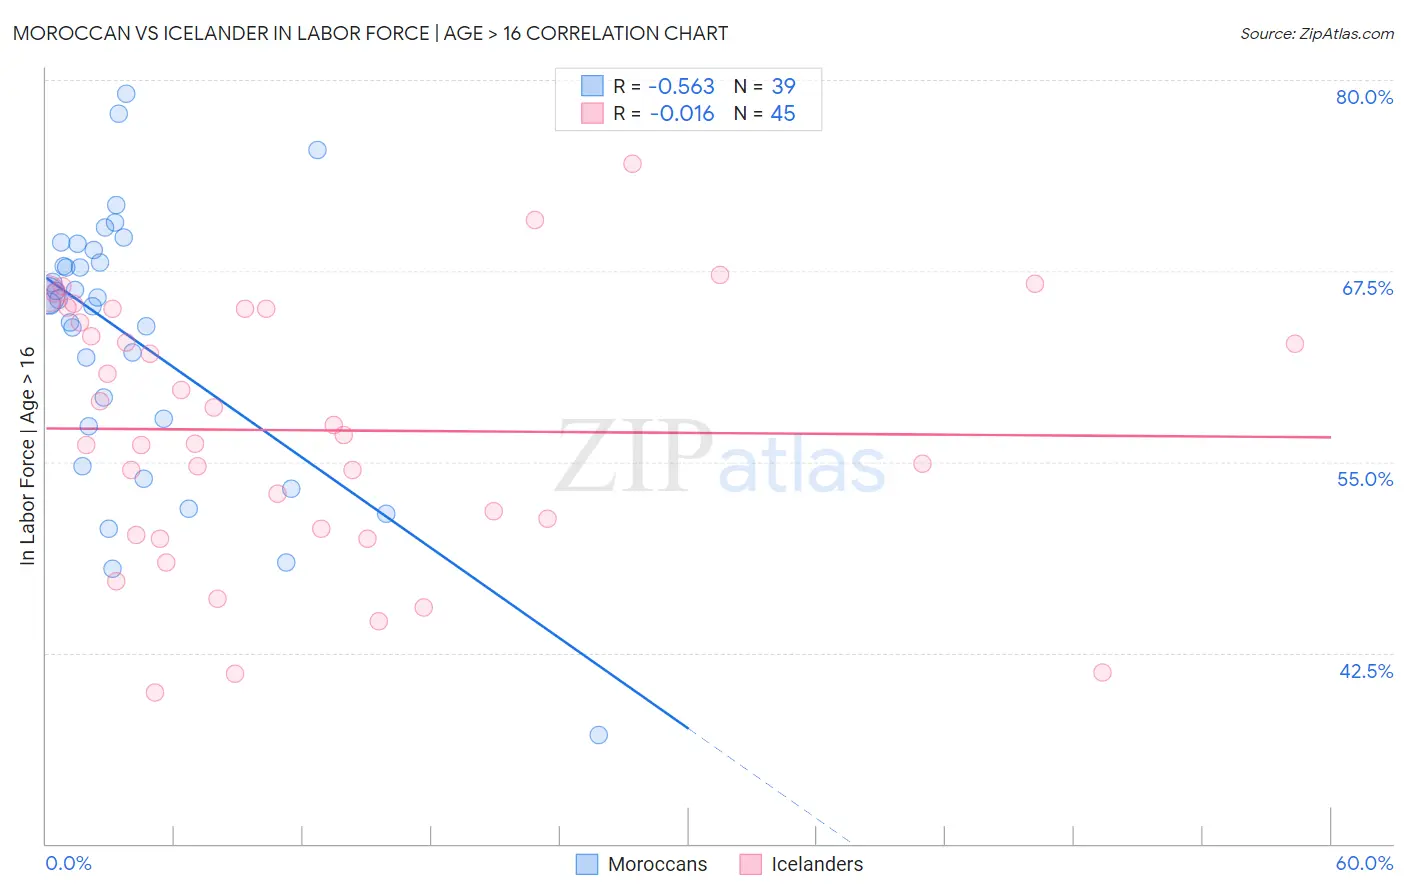
Moroccan vs Icelander In Labor Force | Age > 16 Correlation Chart

The statistical analysis conducted on geographies consisting of 201,807,372 people shows a substantial negative correlation between the proportion of Moroccans and labor force participation rate among population ages 16 and over in the United States with a correlation coefficient (R) of -0.563 and weighted average of 66.1%. Similarly, the statistical analysis conducted on geographies consisting of 159,668,800 people shows no correlation between the proportion of Icelanders and labor force participation rate among population ages 16 and over in the United States with a correlation coefficient (R) of -0.016 and weighted average of 65.6%, a difference of 0.68%.
Moroccan vs Icelander In Labor Force | Age > 16

In Labor Force | Age > 16 Correlation Summary

MeasurementMoroccanIcelander
Minimum37.1%39.9%
Maximum79.1%74.5%
Range42.0%34.6%
Mean63.1%57.1%
Median65.7%56.8%
Interquartile 25% (IQ1)57.4%50.4%
Interquartile 75% (IQ3)68.9%65.0%
Interquartile Range (IQR)11.5%14.6%
Standard Deviation (Sample)8.9%8.5%
Standard Deviation (Population)8.7%8.4%

Similar Demographics by In Labor Force | Age > 16

Demographics Similar to Moroccans by In Labor Force | Age > 16

In terms of in labor force | age > 16, the demographic groups most similar to Moroccans are German Russian (66.1%, a difference of 0.010%), Immigrants from Jordan (66.1%, a difference of 0.010%), Central American (66.1%, a difference of 0.020%), Mongolian (66.1%, a difference of 0.030%), and Malaysian (66.1%, a difference of 0.050%).
DemographicsRating | RankIn Labor Force | Age > 16
Immigrants | Korea
99.7
/100
|
#74
Exceptional
66.2%
Immigrants | Singapore
99.7
/100
|
#75
Exceptional
66.2%
Immigrants | Malaysia
99.6
/100
|
#76
Exceptional
66.1%
Immigrants | Moldova
99.6
/100
|
#77
Exceptional
66.1%
Immigrants | Asia
99.6
/100
|
#78
Exceptional
66.1%
Turks
99.6
/100
|
#79
Exceptional
66.1%
Malaysians
99.6
/100
|
#80
Exceptional
66.1%
Moroccans
99.5
/100
|
#81
Exceptional
66.1%
German Russians
99.4
/100
|
#82
Exceptional
66.1%
Immigrants | Jordan
99.4
/100
|
#83
Exceptional
66.1%
Central Americans
99.4
/100
|
#84
Exceptional
66.1%
Mongolians
99.4
/100
|
#85
Exceptional
66.1%
South Americans
99.4
/100
|
#86
Exceptional
66.0%
South American Indians
99.4
/100
|
#87
Exceptional
66.0%
Bermudans
99.3
/100
|
#88
Exceptional
66.0%

Demographics Similar to Icelanders by In Labor Force | Age > 16

In terms of in labor force | age > 16, the demographic groups most similar to Icelanders are Immigrants from Guatemala (65.6%, a difference of 0.0%), Immigrants from Philippines (65.6%, a difference of 0.010%), Immigrants from North Macedonia (65.6%, a difference of 0.010%), Ecuadorian (65.6%, a difference of 0.020%), and Immigrants from Eastern Asia (65.7%, a difference of 0.030%).
DemographicsRating | RankIn Labor Force | Age > 16
Iraqis
95.4
/100
|
#124
Exceptional
65.7%
Norwegians
95.3
/100
|
#125
Exceptional
65.7%
Koreans
95.3
/100
|
#126
Exceptional
65.7%
Immigrants | Eastern Asia
94.9
/100
|
#127
Exceptional
65.7%
Ecuadorians
94.7
/100
|
#128
Exceptional
65.6%
Immigrants | Philippines
94.5
/100
|
#129
Exceptional
65.6%
Immigrants | Guatemala
94.4
/100
|
#130
Exceptional
65.6%
Icelanders
94.3
/100
|
#131
Exceptional
65.6%
Immigrants | North Macedonia
94.1
/100
|
#132
Exceptional
65.6%
Immigrants | Lithuania
93.5
/100
|
#133
Exceptional
65.6%
Costa Ricans
93.2
/100
|
#134
Exceptional
65.6%
Guatemalans
92.5
/100
|
#135
Exceptional
65.6%
Immigrants | Argentina
92.4
/100
|
#136
Exceptional
65.6%
Guamanians/Chamorros
92.4
/100
|
#137
Exceptional
65.6%
Immigrants | West Indies
92.0
/100
|
#138
Exceptional
65.6%