Moroccan vs Icelander Divorced or Separated
COMPARE
Moroccan
Icelander
Divorced or Separated
Divorced or Separated Comparison
Moroccans
Icelanders
12.1%
DIVORCED OR SEPARATED
34.8/ 100
METRIC RATING
190th/ 347
METRIC RANK
12.0%
DIVORCED OR SEPARATED
66.0/ 100
METRIC RATING
158th/ 347
METRIC RANK
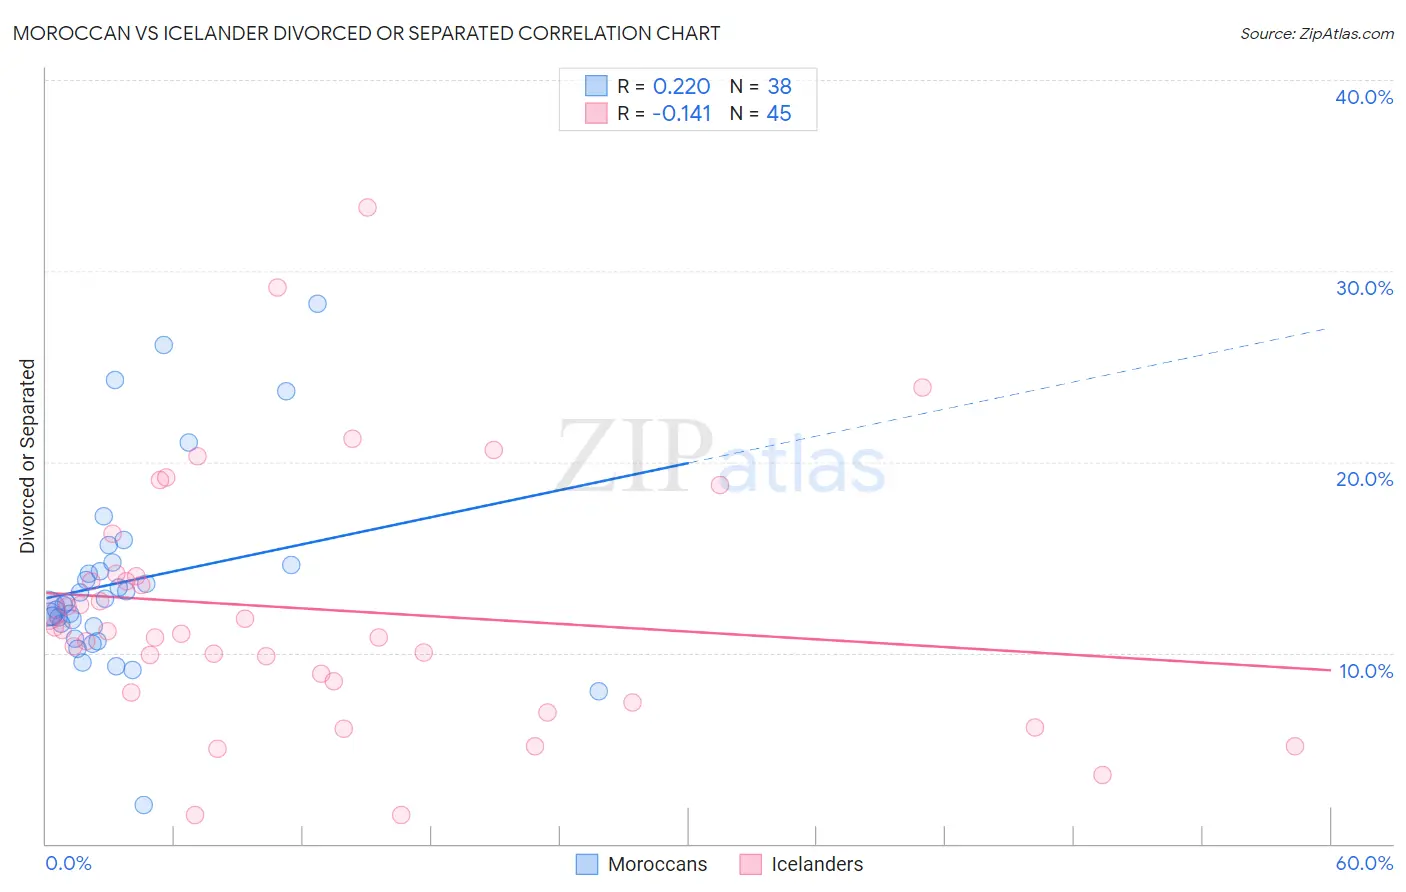
Moroccan vs Icelander Divorced or Separated Correlation Chart
The statistical analysis conducted on geographies consisting of 201,776,444 people shows a weak positive correlation between the proportion of Moroccans and percentage of population currently divorced or separated in the United States with a correlation coefficient (R) of 0.220 and weighted average of 12.1%. Similarly, the statistical analysis conducted on geographies consisting of 159,640,035 people shows a poor negative correlation between the proportion of Icelanders and percentage of population currently divorced or separated in the United States with a correlation coefficient (R) of -0.141 and weighted average of 12.0%, a difference of 1.1%.
Divorced or Separated Correlation Summary
| Measurement | Moroccan | Icelander |
| Minimum | 2.0% | 1.5% |
| Maximum | 28.3% | 33.3% |
| Range | 26.3% | 31.8% |
| Mean | 13.7% | 12.3% |
| Median | 12.6% | 11.1% |
| Interquartile 25% (IQ1) | 11.4% | 8.2% |
| Interquartile 75% (IQ3) | 14.6% | 14.1% |
| Interquartile Range (IQR) | 3.2% | 5.9% |
| Standard Deviation (Sample) | 5.1% | 6.6% |
| Standard Deviation (Population) | 5.0% | 6.5% |
Similar Demographics by Divorced or Separated
Demographics Similar to Moroccans by Divorced or Separated
In terms of divorced or separated, the demographic groups most similar to Moroccans are Swedish (12.1%, a difference of 0.020%), Sierra Leonean (12.1%, a difference of 0.030%), Norwegian (12.1%, a difference of 0.060%), Immigrants from Thailand (12.1%, a difference of 0.090%), and Immigrants from Belize (12.1%, a difference of 0.10%).
| Demographics | Rating | Rank | Divorced or Separated |
| Immigrants | Central America | 42.9 /100 | #183 | Average 12.1% |
| Immigrants | North America | 41.1 /100 | #184 | Average 12.1% |
| Immigrants | Nigeria | 40.5 /100 | #185 | Average 12.1% |
| Immigrants | Chile | 39.0 /100 | #186 | Fair 12.1% |
| Belizeans | 37.7 /100 | #187 | Fair 12.1% |
| Immigrants | Belize | 37.6 /100 | #188 | Fair 12.1% |
| Sierra Leoneans | 35.5 /100 | #189 | Fair 12.1% |
| Moroccans | 34.8 /100 | #190 | Fair 12.1% |
| Swedes | 34.4 /100 | #191 | Fair 12.1% |
| Norwegians | 33.2 /100 | #192 | Fair 12.1% |
| Immigrants | Thailand | 32.5 /100 | #193 | Fair 12.1% |
| Immigrants | Eritrea | 31.9 /100 | #194 | Fair 12.1% |
| Immigrants | England | 31.4 /100 | #195 | Fair 12.1% |
| Immigrants | Burma/Myanmar | 30.4 /100 | #196 | Fair 12.1% |
| Immigrants | Africa | 30.3 /100 | #197 | Fair 12.1% |
Demographics Similar to Icelanders by Divorced or Separated
In terms of divorced or separated, the demographic groups most similar to Icelanders are Immigrants from Barbados (12.0%, a difference of 0.0%), Immigrants from Scotland (12.0%, a difference of 0.010%), Marshallese (12.0%, a difference of 0.060%), Samoan (12.0%, a difference of 0.070%), and Navajo (12.0%, a difference of 0.080%).
| Demographics | Rating | Rank | Divorced or Separated |
| Czechs | 76.4 /100 | #151 | Good 11.9% |
| Immigrants | Hungary | 73.7 /100 | #152 | Good 11.9% |
| Austrians | 72.2 /100 | #153 | Good 12.0% |
| Chileans | 71.3 /100 | #154 | Good 12.0% |
| Japanese | 70.9 /100 | #155 | Good 12.0% |
| Hungarians | 70.3 /100 | #156 | Good 12.0% |
| Immigrants | Brazil | 68.8 /100 | #157 | Good 12.0% |
| Icelanders | 66.0 /100 | #158 | Good 12.0% |
| Immigrants | Barbados | 66.0 /100 | #159 | Good 12.0% |
| Immigrants | Scotland | 65.8 /100 | #160 | Good 12.0% |
| Marshallese | 64.6 /100 | #161 | Good 12.0% |
| Samoans | 64.3 /100 | #162 | Good 12.0% |
| Navajo | 63.9 /100 | #163 | Good 12.0% |
| Swiss | 63.6 /100 | #164 | Good 12.0% |
| German Russians | 61.8 /100 | #165 | Good 12.0% |