Marshallese vs Okinawan In Labor Force | Age 25-29
COMPARE
Marshallese
Okinawan
In Labor Force | Age 25-29
In Labor Force | Age 25-29 Comparison
Marshallese
Okinawans
83.3%
IN LABOR FORCE | AGE 25-29
0.0/ 100
METRIC RATING
274th/ 347
METRIC RANK
85.2%
IN LABOR FORCE | AGE 25-29
97.0/ 100
METRIC RATING
82nd/ 347
METRIC RANK
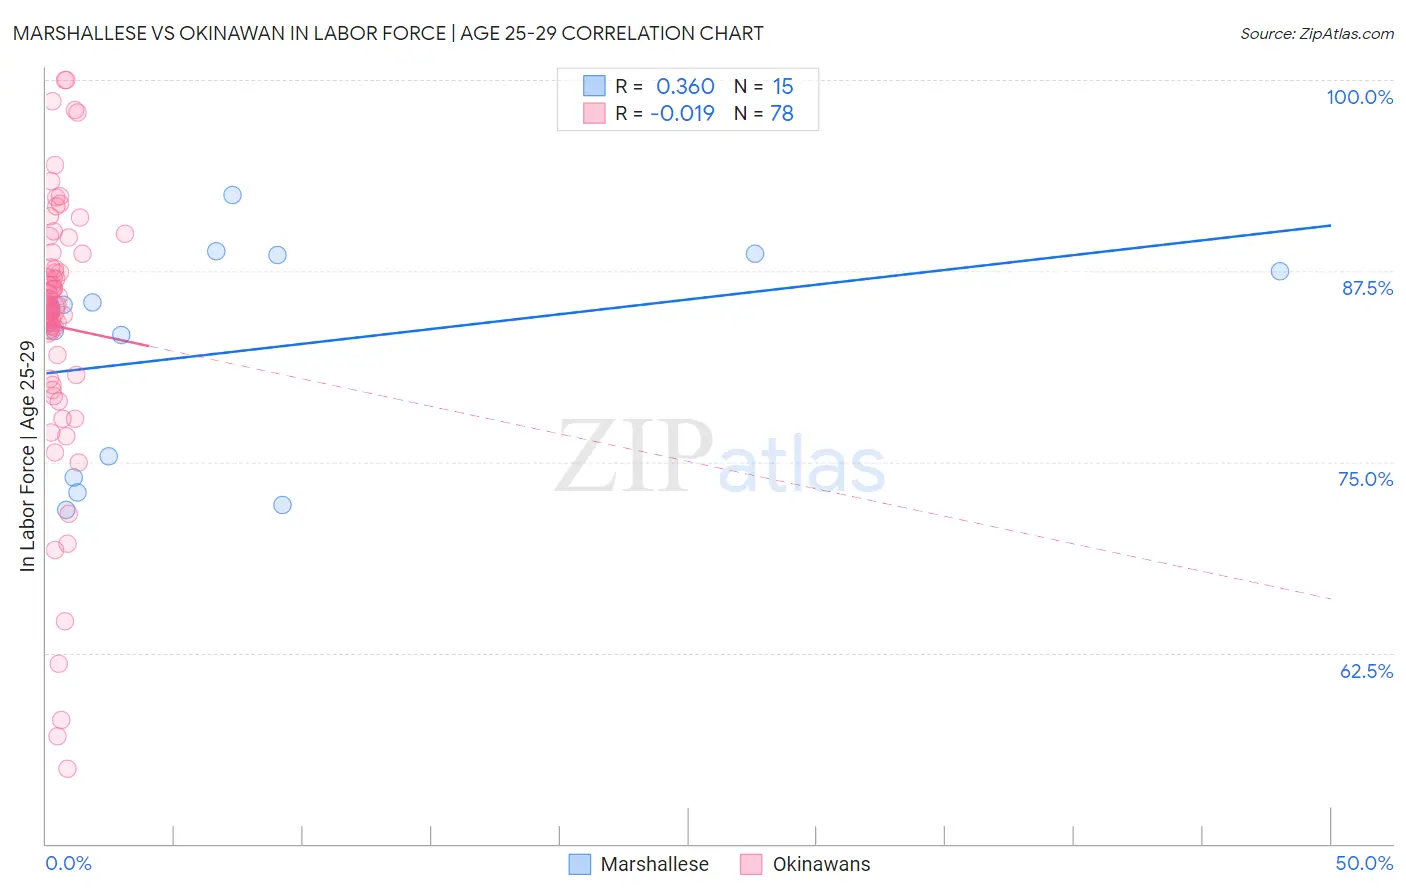
Marshallese vs Okinawan In Labor Force | Age 25-29 Correlation Chart
The statistical analysis conducted on geographies consisting of 14,760,991 people shows a mild positive correlation between the proportion of Marshallese and labor force participation rate among population between the ages 25 and 29 in the United States with a correlation coefficient (R) of 0.360 and weighted average of 83.3%. Similarly, the statistical analysis conducted on geographies consisting of 73,774,164 people shows no correlation between the proportion of Okinawans and labor force participation rate among population between the ages 25 and 29 in the United States with a correlation coefficient (R) of -0.019 and weighted average of 85.2%, a difference of 2.2%.
In Labor Force | Age 25-29 Correlation Summary
| Measurement | Marshallese | Okinawan |
| Minimum | 71.9% | 54.9% |
| Maximum | 92.5% | 100.0% |
| Range | 20.6% | 45.1% |
| Mean | 82.3% | 83.9% |
| Median | 85.0% | 85.1% |
| Interquartile 25% (IQ1) | 74.0% | 80.7% |
| Interquartile 75% (IQ3) | 88.6% | 87.7% |
| Interquartile Range (IQR) | 14.6% | 7.0% |
| Standard Deviation (Sample) | 7.0% | 8.9% |
| Standard Deviation (Population) | 6.8% | 8.9% |
Similar Demographics by In Labor Force | Age 25-29
Demographics Similar to Marshallese by In Labor Force | Age 25-29
In terms of in labor force | age 25-29, the demographic groups most similar to Marshallese are Immigrants from Caribbean (83.4%, a difference of 0.030%), Immigrants from Dominica (83.4%, a difference of 0.030%), Samoan (83.3%, a difference of 0.050%), Immigrants from Honduras (83.3%, a difference of 0.050%), and Honduran (83.4%, a difference of 0.060%).
| Demographics | Rating | Rank | In Labor Force | Age 25-29 |
| Spanish Americans | 0.0 /100 | #267 | Tragic 83.4% |
| Immigrants | Lebanon | 0.0 /100 | #268 | Tragic 83.4% |
| Immigrants | Barbados | 0.0 /100 | #269 | Tragic 83.4% |
| Basques | 0.0 /100 | #270 | Tragic 83.4% |
| Hondurans | 0.0 /100 | #271 | Tragic 83.4% |
| Immigrants | Caribbean | 0.0 /100 | #272 | Tragic 83.4% |
| Immigrants | Dominica | 0.0 /100 | #273 | Tragic 83.4% |
| Marshallese | 0.0 /100 | #274 | Tragic 83.3% |
| Samoans | 0.0 /100 | #275 | Tragic 83.3% |
| Immigrants | Honduras | 0.0 /100 | #276 | Tragic 83.3% |
| Africans | 0.0 /100 | #277 | Tragic 83.2% |
| Immigrants | Cuba | 0.0 /100 | #278 | Tragic 83.2% |
| British West Indians | 0.0 /100 | #279 | Tragic 83.2% |
| Dominicans | 0.0 /100 | #280 | Tragic 83.2% |
| Immigrants | Dominican Republic | 0.0 /100 | #281 | Tragic 83.1% |
Demographics Similar to Okinawans by In Labor Force | Age 25-29
In terms of in labor force | age 25-29, the demographic groups most similar to Okinawans are Immigrants from Europe (85.2%, a difference of 0.010%), Immigrants from Eastern Europe (85.2%, a difference of 0.010%), Immigrants from Africa (85.2%, a difference of 0.010%), Immigrants from Northern Europe (85.2%, a difference of 0.020%), and Ukrainian (85.2%, a difference of 0.020%).
| Demographics | Rating | Rank | In Labor Force | Age 25-29 |
| Brazilians | 98.3 /100 | #75 | Exceptional 85.3% |
| Germans | 98.1 /100 | #76 | Exceptional 85.3% |
| Immigrants | South Central Asia | 97.9 /100 | #77 | Exceptional 85.2% |
| Immigrants | Egypt | 97.7 /100 | #78 | Exceptional 85.2% |
| Immigrants | Northern Africa | 97.6 /100 | #79 | Exceptional 85.2% |
| Immigrants | Zimbabwe | 97.6 /100 | #80 | Exceptional 85.2% |
| Immigrants | Northern Europe | 97.2 /100 | #81 | Exceptional 85.2% |
| Okinawans | 97.0 /100 | #82 | Exceptional 85.2% |
| Immigrants | Europe | 96.8 /100 | #83 | Exceptional 85.2% |
| Immigrants | Eastern Europe | 96.8 /100 | #84 | Exceptional 85.2% |
| Immigrants | Africa | 96.7 /100 | #85 | Exceptional 85.2% |
| Ukrainians | 96.7 /100 | #86 | Exceptional 85.2% |
| French Canadians | 96.5 /100 | #87 | Exceptional 85.2% |
| Immigrants | Croatia | 96.4 /100 | #88 | Exceptional 85.2% |
| Immigrants | France | 96.3 /100 | #89 | Exceptional 85.2% |