Marshallese vs Immigrants from Venezuela In Labor Force | Age 25-29
COMPARE
Marshallese
Immigrants from Venezuela
In Labor Force | Age 25-29
In Labor Force | Age 25-29 Comparison
Marshallese
Immigrants from Venezuela
83.3%
IN LABOR FORCE | AGE 25-29
0.0/ 100
METRIC RATING
274th/ 347
METRIC RANK
84.3%
IN LABOR FORCE | AGE 25-29
12.6/ 100
METRIC RATING
211th/ 347
METRIC RANK
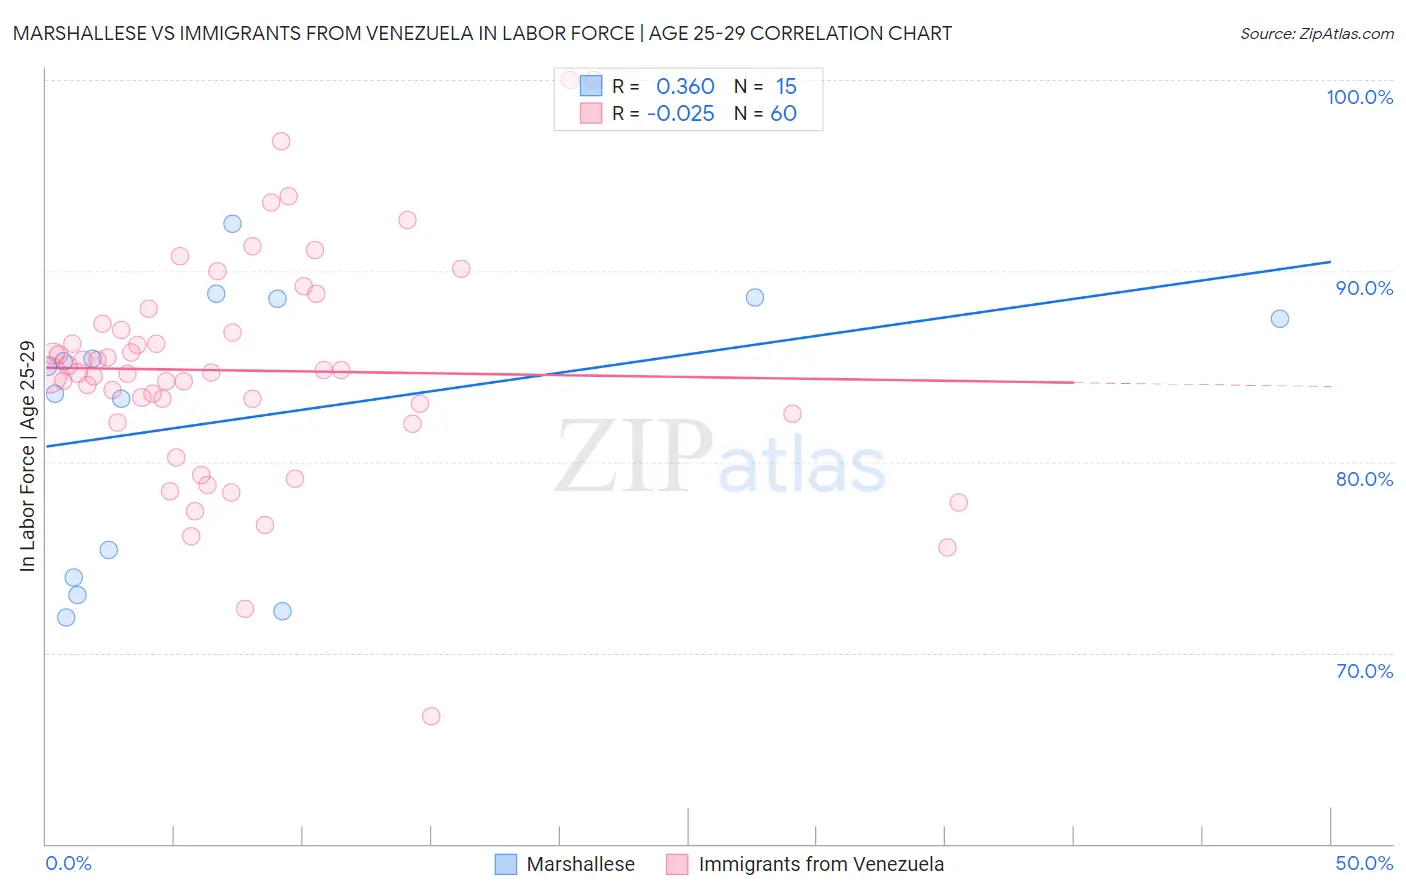
Marshallese vs Immigrants from Venezuela In Labor Force | Age 25-29 Correlation Chart
The statistical analysis conducted on geographies consisting of 14,760,991 people shows a mild positive correlation between the proportion of Marshallese and labor force participation rate among population between the ages 25 and 29 in the United States with a correlation coefficient (R) of 0.360 and weighted average of 83.3%. Similarly, the statistical analysis conducted on geographies consisting of 287,835,027 people shows no correlation between the proportion of Immigrants from Venezuela and labor force participation rate among population between the ages 25 and 29 in the United States with a correlation coefficient (R) of -0.025 and weighted average of 84.3%, a difference of 1.2%.
In Labor Force | Age 25-29 Correlation Summary
| Measurement | Marshallese | Immigrants from Venezuela |
| Minimum | 71.9% | 66.7% |
| Maximum | 92.5% | 100.0% |
| Range | 20.6% | 33.3% |
| Mean | 82.3% | 84.8% |
| Median | 85.0% | 84.7% |
| Interquartile 25% (IQ1) | 74.0% | 82.3% |
| Interquartile 75% (IQ3) | 88.6% | 87.1% |
| Interquartile Range (IQR) | 14.6% | 4.8% |
| Standard Deviation (Sample) | 7.0% | 6.0% |
| Standard Deviation (Population) | 6.8% | 5.9% |
Similar Demographics by In Labor Force | Age 25-29
Demographics Similar to Marshallese by In Labor Force | Age 25-29
In terms of in labor force | age 25-29, the demographic groups most similar to Marshallese are Immigrants from Caribbean (83.4%, a difference of 0.030%), Immigrants from Dominica (83.4%, a difference of 0.030%), Samoan (83.3%, a difference of 0.050%), Immigrants from Honduras (83.3%, a difference of 0.050%), and Honduran (83.4%, a difference of 0.060%).
| Demographics | Rating | Rank | In Labor Force | Age 25-29 |
| Spanish Americans | 0.0 /100 | #267 | Tragic 83.4% |
| Immigrants | Lebanon | 0.0 /100 | #268 | Tragic 83.4% |
| Immigrants | Barbados | 0.0 /100 | #269 | Tragic 83.4% |
| Basques | 0.0 /100 | #270 | Tragic 83.4% |
| Hondurans | 0.0 /100 | #271 | Tragic 83.4% |
| Immigrants | Caribbean | 0.0 /100 | #272 | Tragic 83.4% |
| Immigrants | Dominica | 0.0 /100 | #273 | Tragic 83.4% |
| Marshallese | 0.0 /100 | #274 | Tragic 83.3% |
| Samoans | 0.0 /100 | #275 | Tragic 83.3% |
| Immigrants | Honduras | 0.0 /100 | #276 | Tragic 83.3% |
| Africans | 0.0 /100 | #277 | Tragic 83.2% |
| Immigrants | Cuba | 0.0 /100 | #278 | Tragic 83.2% |
| British West Indians | 0.0 /100 | #279 | Tragic 83.2% |
| Dominicans | 0.0 /100 | #280 | Tragic 83.2% |
| Immigrants | Dominican Republic | 0.0 /100 | #281 | Tragic 83.1% |
Demographics Similar to Immigrants from Venezuela by In Labor Force | Age 25-29
In terms of in labor force | age 25-29, the demographic groups most similar to Immigrants from Venezuela are Immigrants from Jordan (84.4%, a difference of 0.0%), Chinese (84.3%, a difference of 0.0%), Immigrants from Armenia (84.4%, a difference of 0.010%), Immigrants from Indonesia (84.4%, a difference of 0.010%), and Subsaharan African (84.3%, a difference of 0.020%).
| Demographics | Rating | Rank | In Labor Force | Age 25-29 |
| Venezuelans | 15.1 /100 | #204 | Poor 84.4% |
| Ecuadorians | 14.8 /100 | #205 | Poor 84.4% |
| Immigrants | Cambodia | 14.3 /100 | #206 | Poor 84.4% |
| Immigrants | Armenia | 13.3 /100 | #207 | Poor 84.4% |
| Immigrants | Indonesia | 13.2 /100 | #208 | Poor 84.4% |
| Immigrants | Jordan | 12.8 /100 | #209 | Poor 84.4% |
| Chinese | 12.7 /100 | #210 | Poor 84.3% |
| Immigrants | Venezuela | 12.6 /100 | #211 | Poor 84.3% |
| Sub-Saharan Africans | 11.7 /100 | #212 | Poor 84.3% |
| Japanese | 11.4 /100 | #213 | Poor 84.3% |
| Lebanese | 11.1 /100 | #214 | Poor 84.3% |
| Immigrants | Syria | 10.7 /100 | #215 | Poor 84.3% |
| Israelis | 9.3 /100 | #216 | Tragic 84.3% |
| Immigrants | Ecuador | 9.3 /100 | #217 | Tragic 84.3% |
| Immigrants | Nigeria | 9.0 /100 | #218 | Tragic 84.3% |