Iroquois vs Immigrants from Switzerland In Labor Force | Age 45-54
COMPARE
Iroquois
Immigrants from Switzerland
In Labor Force | Age 45-54
In Labor Force | Age 45-54 Comparison
Iroquois
Immigrants from Switzerland
80.6%
IN LABOR FORCE | AGE 45-54
0.0/ 100
METRIC RATING
292nd/ 347
METRIC RANK
82.7%
IN LABOR FORCE | AGE 45-54
39.4/ 100
METRIC RATING
179th/ 347
METRIC RANK
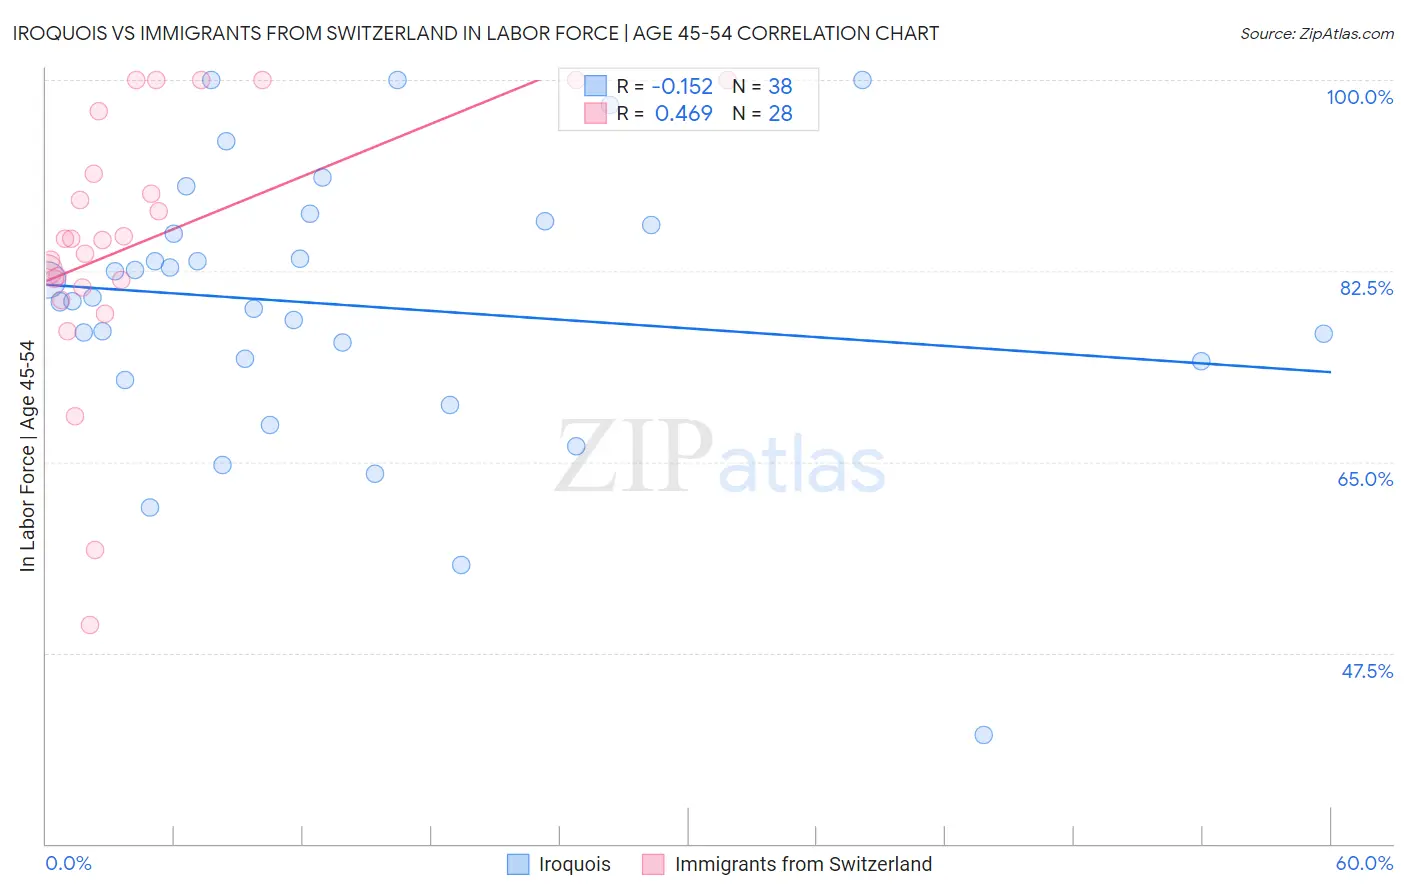
Iroquois vs Immigrants from Switzerland In Labor Force | Age 45-54 Correlation Chart
The statistical analysis conducted on geographies consisting of 207,246,780 people shows a poor negative correlation between the proportion of Iroquois and labor force participation rate among population between the ages 45 and 54 in the United States with a correlation coefficient (R) of -0.152 and weighted average of 80.6%. Similarly, the statistical analysis conducted on geographies consisting of 148,071,705 people shows a moderate positive correlation between the proportion of Immigrants from Switzerland and labor force participation rate among population between the ages 45 and 54 in the United States with a correlation coefficient (R) of 0.469 and weighted average of 82.7%, a difference of 2.6%.
In Labor Force | Age 45-54 Correlation Summary
| Measurement | Iroquois | Immigrants from Switzerland |
| Minimum | 40.0% | 50.0% |
| Maximum | 100.0% | 100.0% |
| Range | 60.0% | 50.0% |
| Mean | 79.3% | 85.2% |
| Median | 79.9% | 85.4% |
| Interquartile 25% (IQ1) | 74.2% | 81.4% |
| Interquartile 75% (IQ3) | 86.7% | 94.3% |
| Interquartile Range (IQR) | 12.5% | 12.9% |
| Standard Deviation (Sample) | 12.6% | 12.2% |
| Standard Deviation (Population) | 12.4% | 12.0% |
Similar Demographics by In Labor Force | Age 45-54
Demographics Similar to Iroquois by In Labor Force | Age 45-54
In terms of in labor force | age 45-54, the demographic groups most similar to Iroquois are Osage (80.6%, a difference of 0.020%), Yakama (80.6%, a difference of 0.020%), Immigrants from Belize (80.6%, a difference of 0.030%), Nepalese (80.5%, a difference of 0.090%), and African (80.5%, a difference of 0.12%).
| Demographics | Rating | Rank | In Labor Force | Age 45-54 |
| Delaware | 0.0 /100 | #285 | Tragic 80.8% |
| Immigrants | Dominica | 0.0 /100 | #286 | Tragic 80.8% |
| Vietnamese | 0.0 /100 | #287 | Tragic 80.8% |
| Cree | 0.0 /100 | #288 | Tragic 80.8% |
| Immigrants | Bangladesh | 0.0 /100 | #289 | Tragic 80.7% |
| Mexican American Indians | 0.0 /100 | #290 | Tragic 80.7% |
| Immigrants | Belize | 0.0 /100 | #291 | Tragic 80.6% |
| Iroquois | 0.0 /100 | #292 | Tragic 80.6% |
| Osage | 0.0 /100 | #293 | Tragic 80.6% |
| Yakama | 0.0 /100 | #294 | Tragic 80.6% |
| Nepalese | 0.0 /100 | #295 | Tragic 80.5% |
| Africans | 0.0 /100 | #296 | Tragic 80.5% |
| Americans | 0.0 /100 | #297 | Tragic 80.4% |
| Marshallese | 0.0 /100 | #298 | Tragic 80.3% |
| Dominicans | 0.0 /100 | #299 | Tragic 80.3% |
Demographics Similar to Immigrants from Switzerland by In Labor Force | Age 45-54
In terms of in labor force | age 45-54, the demographic groups most similar to Immigrants from Switzerland are Nigerian (82.7%, a difference of 0.010%), Hungarian (82.7%, a difference of 0.010%), Israeli (82.7%, a difference of 0.020%), Immigrants from Hungary (82.7%, a difference of 0.020%), and Immigrants from Nicaragua (82.7%, a difference of 0.050%).
| Demographics | Rating | Rank | In Labor Force | Age 45-54 |
| Icelanders | 51.8 /100 | #172 | Average 82.8% |
| Nicaraguans | 50.3 /100 | #173 | Average 82.8% |
| Costa Ricans | 50.0 /100 | #174 | Average 82.8% |
| Immigrants | Liberia | 47.9 /100 | #175 | Average 82.7% |
| Northern Europeans | 46.9 /100 | #176 | Average 82.7% |
| Immigrants | Nicaragua | 44.6 /100 | #177 | Average 82.7% |
| Nigerians | 40.5 /100 | #178 | Average 82.7% |
| Immigrants | Switzerland | 39.4 /100 | #179 | Fair 82.7% |
| Hungarians | 38.0 /100 | #180 | Fair 82.7% |
| Israelis | 37.7 /100 | #181 | Fair 82.7% |
| Immigrants | Hungary | 37.1 /100 | #182 | Fair 82.7% |
| New Zealanders | 32.7 /100 | #183 | Fair 82.6% |
| Europeans | 32.6 /100 | #184 | Fair 82.6% |
| Immigrants | England | 32.2 /100 | #185 | Fair 82.6% |
| Irish | 29.2 /100 | #186 | Fair 82.6% |