Assyrian/Chaldean/Syriac vs Immigrants from Switzerland In Labor Force | Age 45-54
COMPARE
Assyrian/Chaldean/Syriac
Immigrants from Switzerland
In Labor Force | Age 45-54
In Labor Force | Age 45-54 Comparison
Assyrians/Chaldeans/Syriacs
Immigrants from Switzerland
83.2%
IN LABOR FORCE | AGE 45-54
91.7/ 100
METRIC RATING
114th/ 347
METRIC RANK
82.7%
IN LABOR FORCE | AGE 45-54
39.4/ 100
METRIC RATING
179th/ 347
METRIC RANK
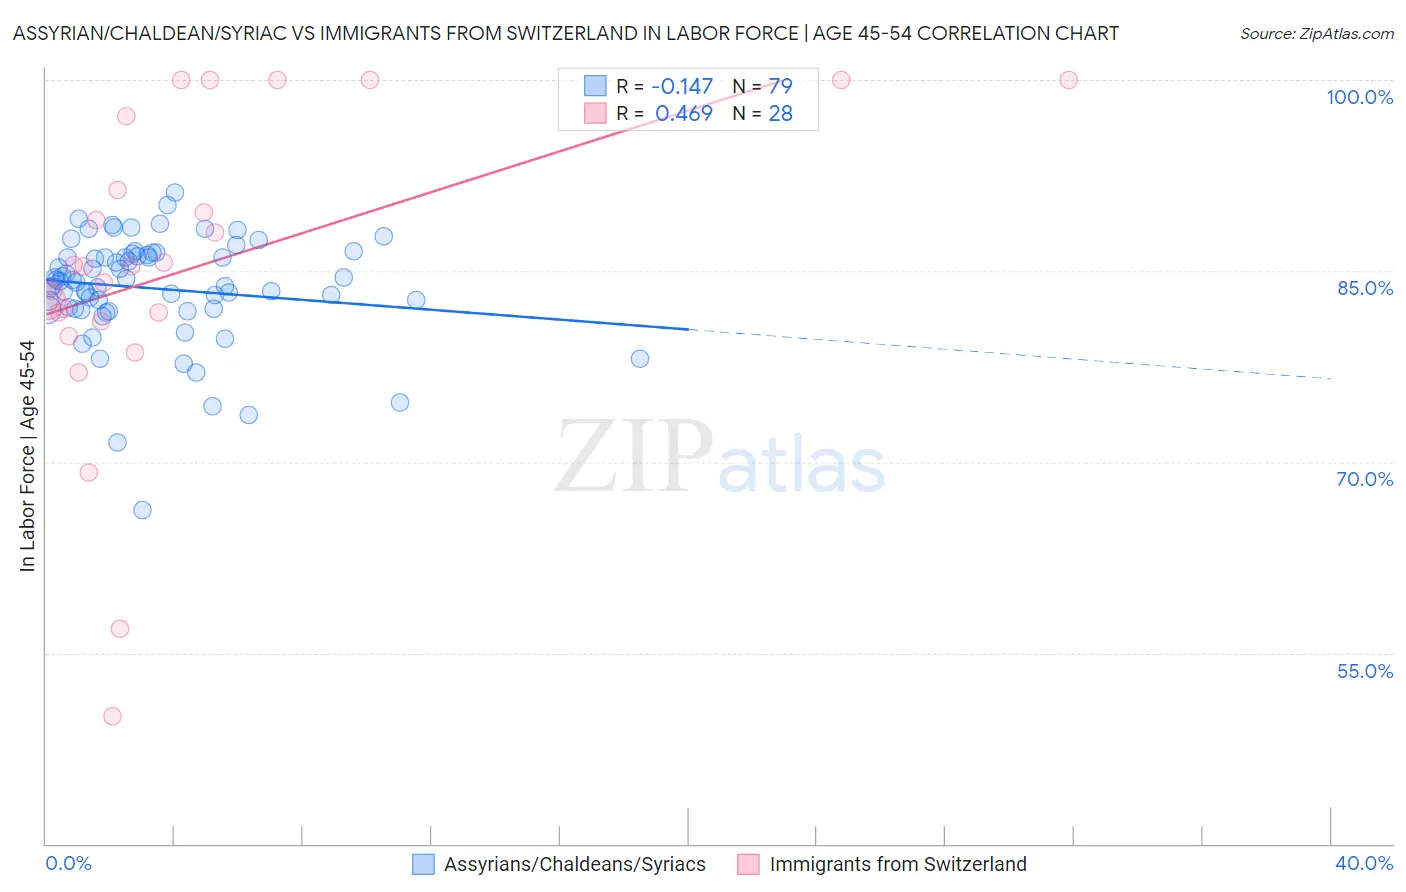
Assyrian/Chaldean/Syriac vs Immigrants from Switzerland In Labor Force | Age 45-54 Correlation Chart
The statistical analysis conducted on geographies consisting of 110,290,950 people shows a poor negative correlation between the proportion of Assyrians/Chaldeans/Syriacs and labor force participation rate among population between the ages 45 and 54 in the United States with a correlation coefficient (R) of -0.147 and weighted average of 83.2%. Similarly, the statistical analysis conducted on geographies consisting of 148,071,705 people shows a moderate positive correlation between the proportion of Immigrants from Switzerland and labor force participation rate among population between the ages 45 and 54 in the United States with a correlation coefficient (R) of 0.469 and weighted average of 82.7%, a difference of 0.62%.
In Labor Force | Age 45-54 Correlation Summary
| Measurement | Assyrian/Chaldean/Syriac | Immigrants from Switzerland |
| Minimum | 66.2% | 50.0% |
| Maximum | 91.2% | 100.0% |
| Range | 25.0% | 50.0% |
| Mean | 83.6% | 85.2% |
| Median | 84.2% | 85.4% |
| Interquartile 25% (IQ1) | 82.0% | 81.4% |
| Interquartile 75% (IQ3) | 86.3% | 94.3% |
| Interquartile Range (IQR) | 4.3% | 12.9% |
| Standard Deviation (Sample) | 4.2% | 12.2% |
| Standard Deviation (Population) | 4.2% | 12.0% |
Similar Demographics by In Labor Force | Age 45-54
Demographics Similar to Assyrians/Chaldeans/Syriacs by In Labor Force | Age 45-54
In terms of in labor force | age 45-54, the demographic groups most similar to Assyrians/Chaldeans/Syriacs are Immigrants from Albania (83.2%, a difference of 0.0%), Immigrants from Chile (83.2%, a difference of 0.0%), Immigrants from Malaysia (83.2%, a difference of 0.010%), Immigrants from Italy (83.2%, a difference of 0.020%), and Immigrants from Afghanistan (83.2%, a difference of 0.020%).
| Demographics | Rating | Rank | In Labor Force | Age 45-54 |
| Iranians | 92.9 /100 | #107 | Exceptional 83.2% |
| Slovaks | 92.8 /100 | #108 | Exceptional 83.2% |
| Ukrainians | 92.7 /100 | #109 | Exceptional 83.2% |
| Immigrants | Africa | 92.6 /100 | #110 | Exceptional 83.2% |
| Immigrants | Italy | 92.5 /100 | #111 | Exceptional 83.2% |
| Immigrants | Afghanistan | 92.4 /100 | #112 | Exceptional 83.2% |
| Immigrants | Albania | 91.8 /100 | #113 | Exceptional 83.2% |
| Assyrians/Chaldeans/Syriacs | 91.7 /100 | #114 | Exceptional 83.2% |
| Immigrants | Chile | 91.6 /100 | #115 | Exceptional 83.2% |
| Immigrants | Malaysia | 91.4 /100 | #116 | Exceptional 83.2% |
| Immigrants | China | 90.9 /100 | #117 | Exceptional 83.2% |
| Immigrants | Europe | 90.7 /100 | #118 | Exceptional 83.2% |
| Immigrants | Uruguay | 90.2 /100 | #119 | Exceptional 83.2% |
| Immigrants | Russia | 90.1 /100 | #120 | Exceptional 83.2% |
| Uruguayans | 89.4 /100 | #121 | Excellent 83.1% |
Demographics Similar to Immigrants from Switzerland by In Labor Force | Age 45-54
In terms of in labor force | age 45-54, the demographic groups most similar to Immigrants from Switzerland are Nigerian (82.7%, a difference of 0.010%), Hungarian (82.7%, a difference of 0.010%), Israeli (82.7%, a difference of 0.020%), Immigrants from Hungary (82.7%, a difference of 0.020%), and Immigrants from Nicaragua (82.7%, a difference of 0.050%).
| Demographics | Rating | Rank | In Labor Force | Age 45-54 |
| Icelanders | 51.8 /100 | #172 | Average 82.8% |
| Nicaraguans | 50.3 /100 | #173 | Average 82.8% |
| Costa Ricans | 50.0 /100 | #174 | Average 82.8% |
| Immigrants | Liberia | 47.9 /100 | #175 | Average 82.7% |
| Northern Europeans | 46.9 /100 | #176 | Average 82.7% |
| Immigrants | Nicaragua | 44.6 /100 | #177 | Average 82.7% |
| Nigerians | 40.5 /100 | #178 | Average 82.7% |
| Immigrants | Switzerland | 39.4 /100 | #179 | Fair 82.7% |
| Hungarians | 38.0 /100 | #180 | Fair 82.7% |
| Israelis | 37.7 /100 | #181 | Fair 82.7% |
| Immigrants | Hungary | 37.1 /100 | #182 | Fair 82.7% |
| New Zealanders | 32.7 /100 | #183 | Fair 82.6% |
| Europeans | 32.6 /100 | #184 | Fair 82.6% |
| Immigrants | England | 32.2 /100 | #185 | Fair 82.6% |
| Irish | 29.2 /100 | #186 | Fair 82.6% |