Immigrants from Zaire vs Tlingit-Haida In Labor Force | Age 20-24
COMPARE
Immigrants from Zaire
Tlingit-Haida
In Labor Force | Age 20-24
In Labor Force | Age 20-24 Comparison
Immigrants from Zaire
Tlingit-Haida
76.6%
IN LABOR FORCE | AGE 20-24
99.6/ 100
METRIC RATING
79th/ 347
METRIC RANK
77.9%
IN LABOR FORCE | AGE 20-24
100.0/ 100
METRIC RATING
25th/ 347
METRIC RANK
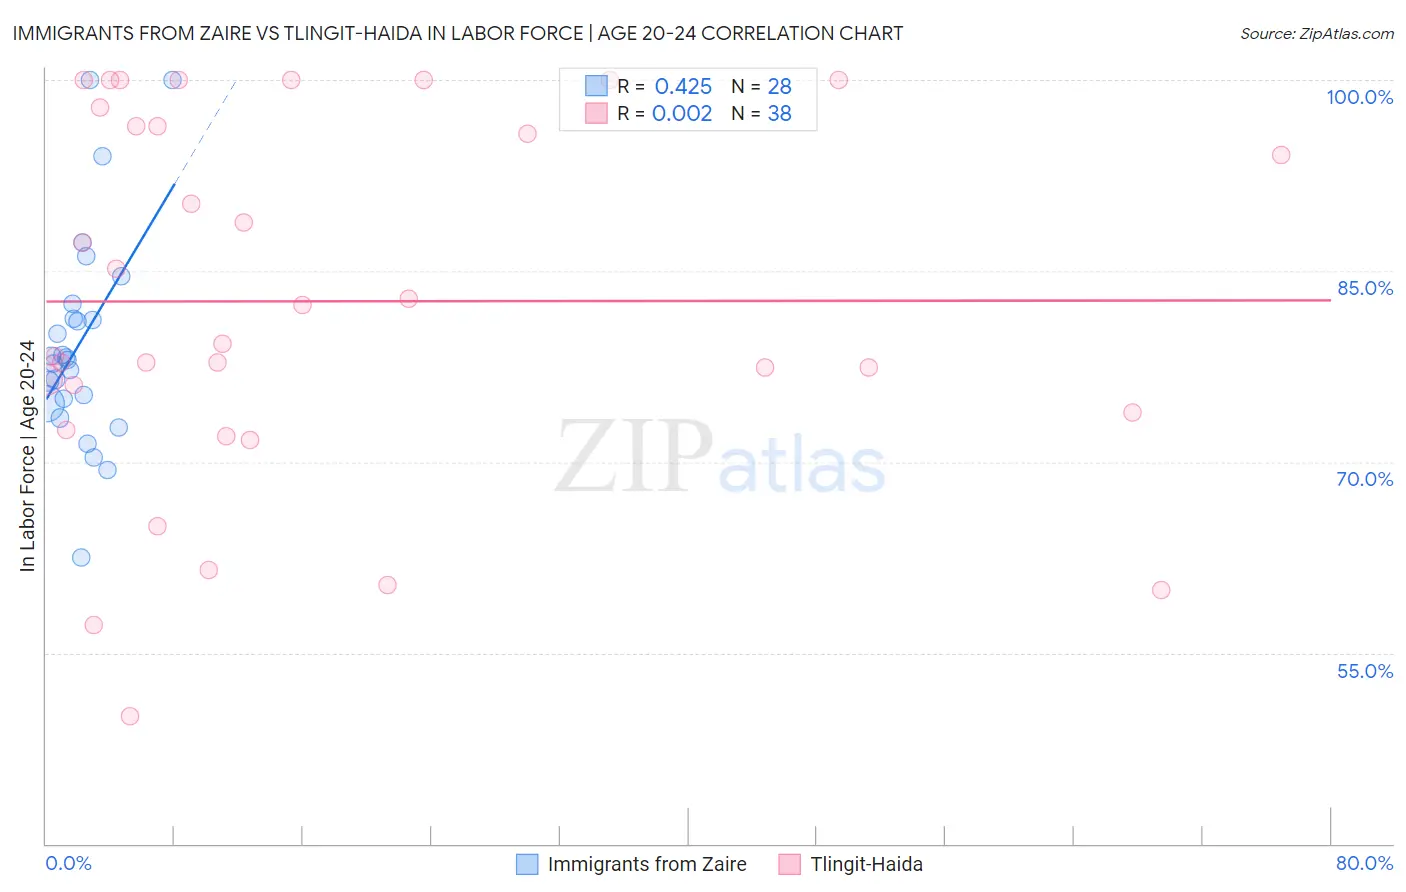
Immigrants from Zaire vs Tlingit-Haida In Labor Force | Age 20-24 Correlation Chart
The statistical analysis conducted on geographies consisting of 107,224,188 people shows a moderate positive correlation between the proportion of Immigrants from Zaire and labor force participation rate among population between the ages 20 and 24 in the United States with a correlation coefficient (R) of 0.425 and weighted average of 76.6%. Similarly, the statistical analysis conducted on geographies consisting of 60,858,700 people shows no correlation between the proportion of Tlingit-Haida and labor force participation rate among population between the ages 20 and 24 in the United States with a correlation coefficient (R) of 0.002 and weighted average of 77.9%, a difference of 1.8%.
In Labor Force | Age 20-24 Correlation Summary
| Measurement | Immigrants from Zaire | Tlingit-Haida |
| Minimum | 62.5% | 50.0% |
| Maximum | 100.0% | 100.0% |
| Range | 37.5% | 50.0% |
| Mean | 79.4% | 82.6% |
| Median | 78.1% | 80.8% |
| Interquartile 25% (IQ1) | 74.7% | 73.9% |
| Interquartile 75% (IQ3) | 81.8% | 96.4% |
| Interquartile Range (IQR) | 7.1% | 22.5% |
| Standard Deviation (Sample) | 8.4% | 14.3% |
| Standard Deviation (Population) | 8.3% | 14.1% |
Similar Demographics by In Labor Force | Age 20-24
Demographics Similar to Immigrants from Zaire by In Labor Force | Age 20-24
In terms of in labor force | age 20-24, the demographic groups most similar to Immigrants from Zaire are Immigrants from Cameroon (76.6%, a difference of 0.020%), Canadian (76.6%, a difference of 0.020%), Italian (76.5%, a difference of 0.030%), Basque (76.5%, a difference of 0.040%), and Hmong (76.5%, a difference of 0.040%).
| Demographics | Rating | Rank | In Labor Force | Age 20-24 |
| Guamanians/Chamorros | 99.8 /100 | #72 | Exceptional 76.7% |
| British | 99.8 /100 | #73 | Exceptional 76.7% |
| Cree | 99.7 /100 | #74 | Exceptional 76.6% |
| Immigrants | Middle Africa | 99.7 /100 | #75 | Exceptional 76.6% |
| Immigrants | Moldova | 99.6 /100 | #76 | Exceptional 76.6% |
| Immigrants | Cameroon | 99.6 /100 | #77 | Exceptional 76.6% |
| Canadians | 99.6 /100 | #78 | Exceptional 76.6% |
| Immigrants | Zaire | 99.6 /100 | #79 | Exceptional 76.6% |
| Italians | 99.6 /100 | #80 | Exceptional 76.5% |
| Basques | 99.5 /100 | #81 | Exceptional 76.5% |
| Hmong | 99.5 /100 | #82 | Exceptional 76.5% |
| Carpatho Rusyns | 99.4 /100 | #83 | Exceptional 76.5% |
| Austrians | 99.4 /100 | #84 | Exceptional 76.5% |
| Portuguese | 99.3 /100 | #85 | Exceptional 76.4% |
| Immigrants | Iraq | 99.3 /100 | #86 | Exceptional 76.4% |
Demographics Similar to Tlingit-Haida by In Labor Force | Age 20-24
In terms of in labor force | age 20-24, the demographic groups most similar to Tlingit-Haida are Tongan (77.9%, a difference of 0.020%), Yugoslavian (78.0%, a difference of 0.040%), Liberian (78.0%, a difference of 0.040%), Pennsylvania German (78.0%, a difference of 0.050%), and Puget Sound Salish (78.0%, a difference of 0.11%).
| Demographics | Rating | Rank | In Labor Force | Age 20-24 |
| Immigrants | Bosnia and Herzegovina | 100.0 /100 | #18 | Exceptional 78.1% |
| Bangladeshis | 100.0 /100 | #19 | Exceptional 78.1% |
| French Canadians | 100.0 /100 | #20 | Exceptional 78.1% |
| Puget Sound Salish | 100.0 /100 | #21 | Exceptional 78.0% |
| Pennsylvania Germans | 100.0 /100 | #22 | Exceptional 78.0% |
| Yugoslavians | 100.0 /100 | #23 | Exceptional 78.0% |
| Liberians | 100.0 /100 | #24 | Exceptional 78.0% |
| Tlingit-Haida | 100.0 /100 | #25 | Exceptional 77.9% |
| Tongans | 100.0 /100 | #26 | Exceptional 77.9% |
| Immigrants | Micronesia | 100.0 /100 | #27 | Exceptional 77.8% |
| Belgians | 100.0 /100 | #28 | Exceptional 77.8% |
| Slovaks | 100.0 /100 | #29 | Exceptional 77.7% |
| Swiss | 100.0 /100 | #30 | Exceptional 77.7% |
| Poles | 100.0 /100 | #31 | Exceptional 77.6% |
| English | 100.0 /100 | #32 | Exceptional 77.6% |