Belizean vs Tlingit-Haida In Labor Force | Age 20-24
COMPARE
Belizean
Tlingit-Haida
In Labor Force | Age 20-24
In Labor Force | Age 20-24 Comparison
Belizeans
Tlingit-Haida
73.4%
IN LABOR FORCE | AGE 20-24
0.3/ 100
METRIC RATING
272nd/ 347
METRIC RANK
77.9%
IN LABOR FORCE | AGE 20-24
100.0/ 100
METRIC RATING
25th/ 347
METRIC RANK
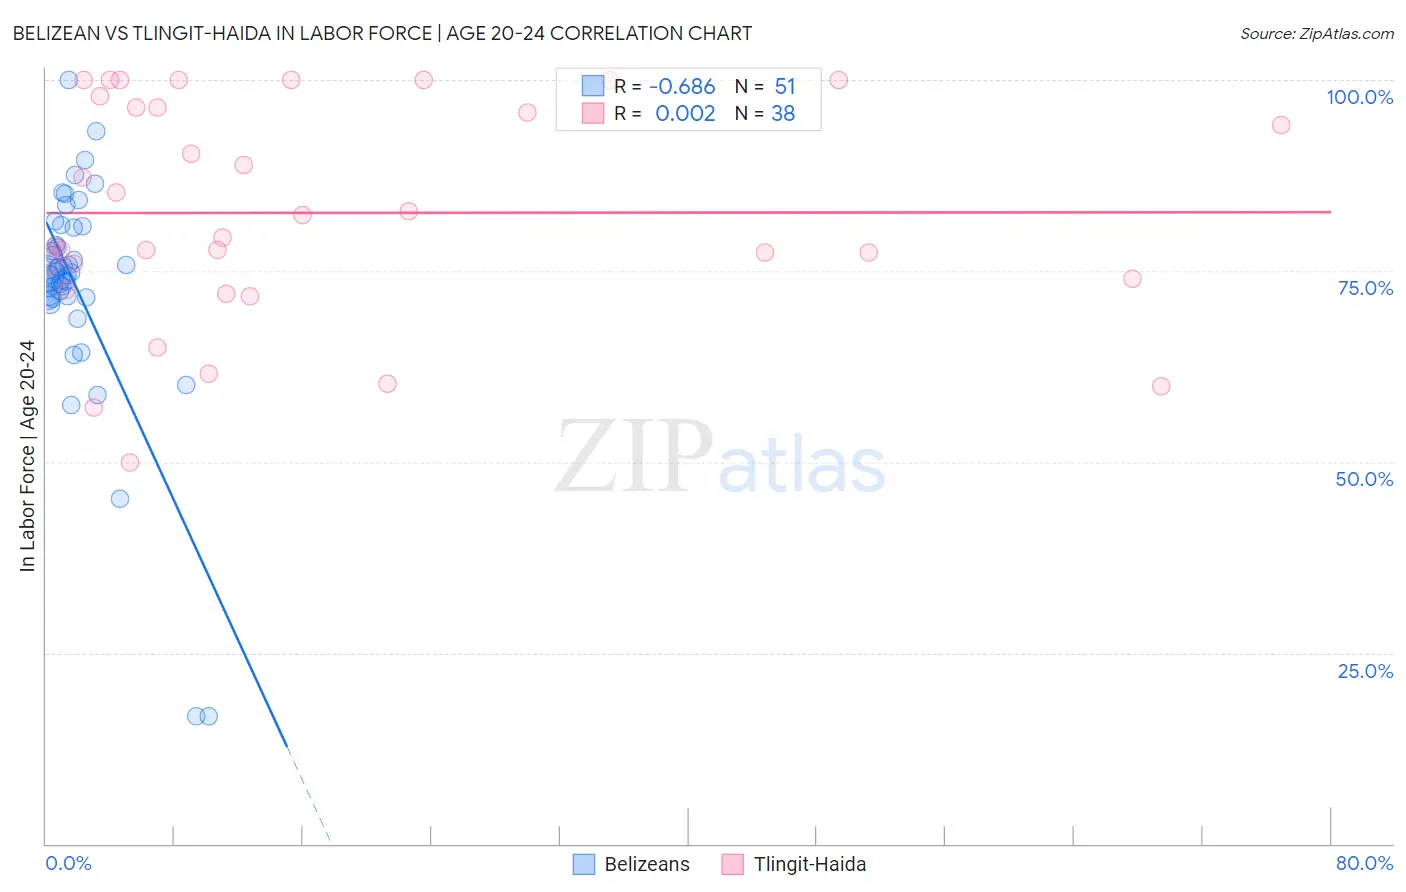
Belizean vs Tlingit-Haida In Labor Force | Age 20-24 Correlation Chart
The statistical analysis conducted on geographies consisting of 144,207,582 people shows a significant negative correlation between the proportion of Belizeans and labor force participation rate among population between the ages 20 and 24 in the United States with a correlation coefficient (R) of -0.686 and weighted average of 73.4%. Similarly, the statistical analysis conducted on geographies consisting of 60,858,700 people shows no correlation between the proportion of Tlingit-Haida and labor force participation rate among population between the ages 20 and 24 in the United States with a correlation coefficient (R) of 0.002 and weighted average of 77.9%, a difference of 6.1%.
In Labor Force | Age 20-24 Correlation Summary
| Measurement | Belizean | Tlingit-Haida |
| Minimum | 16.7% | 50.0% |
| Maximum | 100.0% | 100.0% |
| Range | 83.3% | 50.0% |
| Mean | 73.0% | 82.6% |
| Median | 74.6% | 80.8% |
| Interquartile 25% (IQ1) | 71.5% | 73.9% |
| Interquartile 75% (IQ3) | 80.8% | 96.4% |
| Interquartile Range (IQR) | 9.3% | 22.5% |
| Standard Deviation (Sample) | 14.6% | 14.3% |
| Standard Deviation (Population) | 14.5% | 14.1% |
Similar Demographics by In Labor Force | Age 20-24
Demographics Similar to Belizeans by In Labor Force | Age 20-24
In terms of in labor force | age 20-24, the demographic groups most similar to Belizeans are Immigrants from Indonesia (73.4%, a difference of 0.010%), Cheyenne (73.4%, a difference of 0.030%), Immigrants from Colombia (73.4%, a difference of 0.050%), Immigrants from Russia (73.5%, a difference of 0.060%), and Colombian (73.5%, a difference of 0.10%).
| Demographics | Rating | Rank | In Labor Force | Age 20-24 |
| Burmese | 0.5 /100 | #265 | Tragic 73.6% |
| Haitians | 0.5 /100 | #266 | Tragic 73.6% |
| Immigrants | Western Asia | 0.4 /100 | #267 | Tragic 73.5% |
| South Americans | 0.4 /100 | #268 | Tragic 73.5% |
| Colombians | 0.3 /100 | #269 | Tragic 73.5% |
| Immigrants | Russia | 0.3 /100 | #270 | Tragic 73.5% |
| Immigrants | Indonesia | 0.3 /100 | #271 | Tragic 73.4% |
| Belizeans | 0.3 /100 | #272 | Tragic 73.4% |
| Cheyenne | 0.2 /100 | #273 | Tragic 73.4% |
| Immigrants | Colombia | 0.2 /100 | #274 | Tragic 73.4% |
| Immigrants | South America | 0.2 /100 | #275 | Tragic 73.3% |
| Mongolians | 0.2 /100 | #276 | Tragic 73.3% |
| Immigrants | Malaysia | 0.2 /100 | #277 | Tragic 73.3% |
| Cypriots | 0.2 /100 | #278 | Tragic 73.3% |
| Venezuelans | 0.2 /100 | #279 | Tragic 73.3% |
Demographics Similar to Tlingit-Haida by In Labor Force | Age 20-24
In terms of in labor force | age 20-24, the demographic groups most similar to Tlingit-Haida are Tongan (77.9%, a difference of 0.020%), Yugoslavian (78.0%, a difference of 0.040%), Liberian (78.0%, a difference of 0.040%), Pennsylvania German (78.0%, a difference of 0.050%), and Puget Sound Salish (78.0%, a difference of 0.11%).
| Demographics | Rating | Rank | In Labor Force | Age 20-24 |
| Immigrants | Bosnia and Herzegovina | 100.0 /100 | #18 | Exceptional 78.1% |
| Bangladeshis | 100.0 /100 | #19 | Exceptional 78.1% |
| French Canadians | 100.0 /100 | #20 | Exceptional 78.1% |
| Puget Sound Salish | 100.0 /100 | #21 | Exceptional 78.0% |
| Pennsylvania Germans | 100.0 /100 | #22 | Exceptional 78.0% |
| Yugoslavians | 100.0 /100 | #23 | Exceptional 78.0% |
| Liberians | 100.0 /100 | #24 | Exceptional 78.0% |
| Tlingit-Haida | 100.0 /100 | #25 | Exceptional 77.9% |
| Tongans | 100.0 /100 | #26 | Exceptional 77.9% |
| Immigrants | Micronesia | 100.0 /100 | #27 | Exceptional 77.8% |
| Belgians | 100.0 /100 | #28 | Exceptional 77.8% |
| Slovaks | 100.0 /100 | #29 | Exceptional 77.7% |
| Swiss | 100.0 /100 | #30 | Exceptional 77.7% |
| Poles | 100.0 /100 | #31 | Exceptional 77.6% |
| English | 100.0 /100 | #32 | Exceptional 77.6% |