Immigrants from Switzerland vs Dutch West Indian In Labor Force | Age 20-24
COMPARE
Immigrants from Switzerland
Dutch West Indian
In Labor Force | Age 20-24
In Labor Force | Age 20-24 Comparison
Immigrants from Switzerland
Dutch West Indians
74.2%
IN LABOR FORCE | AGE 20-24
4.1/ 100
METRIC RATING
232nd/ 347
METRIC RANK
73.7%
IN LABOR FORCE | AGE 20-24
0.7/ 100
METRIC RATING
259th/ 347
METRIC RANK
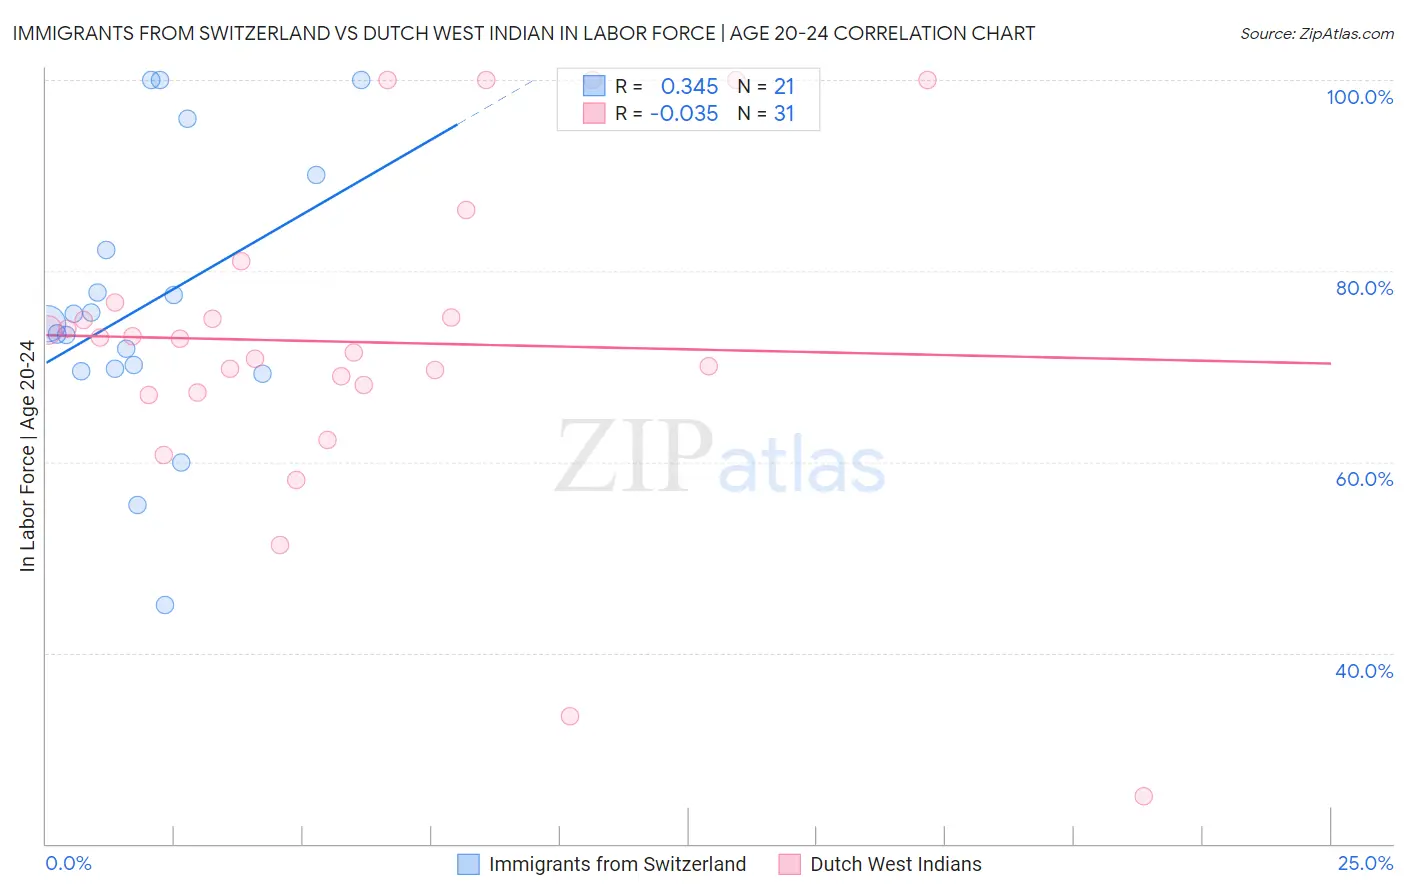
Immigrants from Switzerland vs Dutch West Indian In Labor Force | Age 20-24 Correlation Chart
The statistical analysis conducted on geographies consisting of 148,049,599 people shows a mild positive correlation between the proportion of Immigrants from Switzerland and labor force participation rate among population between the ages 20 and 24 in the United States with a correlation coefficient (R) of 0.345 and weighted average of 74.2%. Similarly, the statistical analysis conducted on geographies consisting of 85,756,423 people shows no correlation between the proportion of Dutch West Indians and labor force participation rate among population between the ages 20 and 24 in the United States with a correlation coefficient (R) of -0.035 and weighted average of 73.7%, a difference of 0.67%.
In Labor Force | Age 20-24 Correlation Summary
| Measurement | Immigrants from Switzerland | Dutch West Indian |
| Minimum | 45.0% | 25.0% |
| Maximum | 100.0% | 100.0% |
| Range | 55.0% | 75.0% |
| Mean | 76.5% | 72.6% |
| Median | 74.4% | 72.9% |
| Interquartile 25% (IQ1) | 69.6% | 67.3% |
| Interquartile 75% (IQ3) | 86.1% | 76.7% |
| Interquartile Range (IQR) | 16.5% | 9.4% |
| Standard Deviation (Sample) | 14.5% | 17.2% |
| Standard Deviation (Population) | 14.1% | 16.9% |
Similar Demographics by In Labor Force | Age 20-24
Demographics Similar to Immigrants from Switzerland by In Labor Force | Age 20-24
In terms of in labor force | age 20-24, the demographic groups most similar to Immigrants from Switzerland are Immigrants from Greece (74.2%, a difference of 0.010%), Immigrants from Albania (74.2%, a difference of 0.020%), Immigrants from Chile (74.1%, a difference of 0.040%), Immigrants from Sweden (74.2%, a difference of 0.050%), and Immigrants (74.1%, a difference of 0.050%).
| Demographics | Rating | Rank | In Labor Force | Age 20-24 |
| Ghanaians | 6.2 /100 | #225 | Tragic 74.3% |
| Immigrants | Fiji | 5.9 /100 | #226 | Tragic 74.3% |
| Immigrants | Ireland | 5.8 /100 | #227 | Tragic 74.3% |
| Immigrants | Ukraine | 5.1 /100 | #228 | Tragic 74.2% |
| Immigrants | Sweden | 4.6 /100 | #229 | Tragic 74.2% |
| Immigrants | Albania | 4.3 /100 | #230 | Tragic 74.2% |
| Immigrants | Greece | 4.1 /100 | #231 | Tragic 74.2% |
| Immigrants | Switzerland | 4.1 /100 | #232 | Tragic 74.2% |
| Immigrants | Chile | 3.7 /100 | #233 | Tragic 74.1% |
| Immigrants | Immigrants | 3.6 /100 | #234 | Tragic 74.1% |
| Laotians | 3.5 /100 | #235 | Tragic 74.1% |
| Immigrants | France | 3.3 /100 | #236 | Tragic 74.1% |
| Bermudans | 3.2 /100 | #237 | Tragic 74.1% |
| Immigrants | Japan | 3.0 /100 | #238 | Tragic 74.1% |
| Immigrants | Latin America | 2.7 /100 | #239 | Tragic 74.1% |
Demographics Similar to Dutch West Indians by In Labor Force | Age 20-24
In terms of in labor force | age 20-24, the demographic groups most similar to Dutch West Indians are Egyptian (73.7%, a difference of 0.0%), Immigrants from Turkey (73.7%, a difference of 0.030%), Paraguayan (73.7%, a difference of 0.040%), Houma (73.7%, a difference of 0.040%), and Asian (73.7%, a difference of 0.050%).
| Demographics | Rating | Rank | In Labor Force | Age 20-24 |
| Immigrants | Kazakhstan | 1.1 /100 | #252 | Tragic 73.8% |
| Arapaho | 1.0 /100 | #253 | Tragic 73.8% |
| Ute | 1.0 /100 | #254 | Tragic 73.8% |
| Immigrants | Pakistan | 0.9 /100 | #255 | Tragic 73.8% |
| Spanish American Indians | 0.8 /100 | #256 | Tragic 73.7% |
| Paraguayans | 0.8 /100 | #257 | Tragic 73.7% |
| Egyptians | 0.7 /100 | #258 | Tragic 73.7% |
| Dutch West Indians | 0.7 /100 | #259 | Tragic 73.7% |
| Immigrants | Turkey | 0.7 /100 | #260 | Tragic 73.7% |
| Houma | 0.6 /100 | #261 | Tragic 73.7% |
| Asians | 0.6 /100 | #262 | Tragic 73.7% |
| Immigrants | Asia | 0.5 /100 | #263 | Tragic 73.6% |
| Immigrants | Haiti | 0.5 /100 | #264 | Tragic 73.6% |
| Burmese | 0.5 /100 | #265 | Tragic 73.6% |
| Haitians | 0.5 /100 | #266 | Tragic 73.6% |