Hopi vs Dutch West Indian In Labor Force | Age 20-24
COMPARE
Hopi
Dutch West Indian
In Labor Force | Age 20-24
In Labor Force | Age 20-24 Comparison
Hopi
Dutch West Indians
66.0%
IN LABOR FORCE | AGE 20-24
0.0/ 100
METRIC RATING
345th/ 347
METRIC RANK
73.7%
IN LABOR FORCE | AGE 20-24
0.7/ 100
METRIC RATING
259th/ 347
METRIC RANK
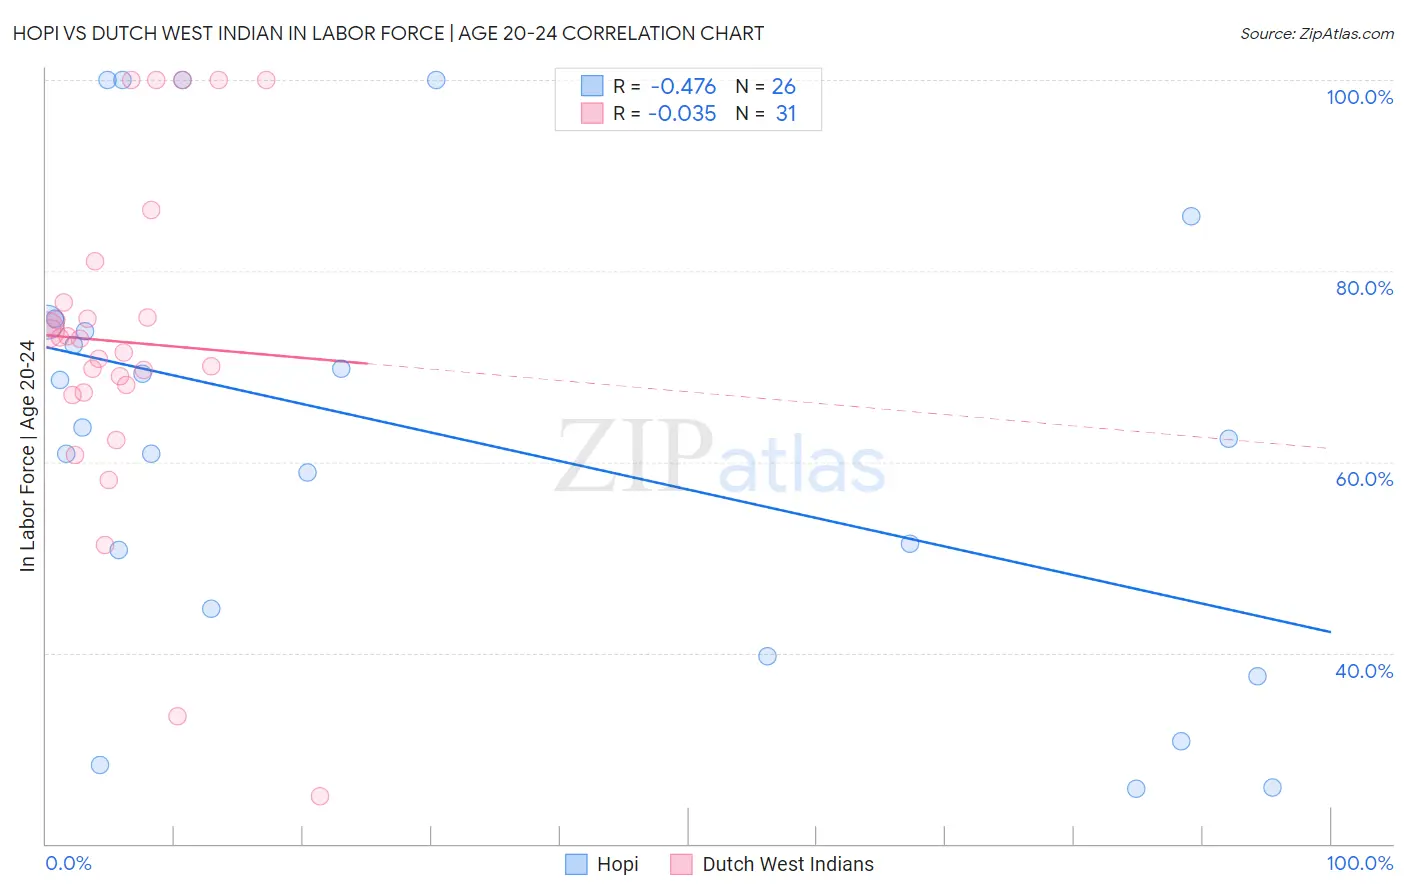
Hopi vs Dutch West Indian In Labor Force | Age 20-24 Correlation Chart
The statistical analysis conducted on geographies consisting of 74,726,569 people shows a moderate negative correlation between the proportion of Hopi and labor force participation rate among population between the ages 20 and 24 in the United States with a correlation coefficient (R) of -0.476 and weighted average of 66.0%. Similarly, the statistical analysis conducted on geographies consisting of 85,756,423 people shows no correlation between the proportion of Dutch West Indians and labor force participation rate among population between the ages 20 and 24 in the United States with a correlation coefficient (R) of -0.035 and weighted average of 73.7%, a difference of 11.6%.
In Labor Force | Age 20-24 Correlation Summary
| Measurement | Hopi | Dutch West Indian |
| Minimum | 25.7% | 25.0% |
| Maximum | 100.0% | 100.0% |
| Range | 74.3% | 75.0% |
| Mean | 62.7% | 72.6% |
| Median | 63.0% | 72.9% |
| Interquartile 25% (IQ1) | 44.6% | 67.3% |
| Interquartile 75% (IQ3) | 74.6% | 76.7% |
| Interquartile Range (IQR) | 30.0% | 9.4% |
| Standard Deviation (Sample) | 23.2% | 17.2% |
| Standard Deviation (Population) | 22.7% | 16.9% |
Similar Demographics by In Labor Force | Age 20-24
Demographics Similar to Hopi by In Labor Force | Age 20-24
In terms of in labor force | age 20-24, the demographic groups most similar to Hopi are Lumbee (65.5%, a difference of 0.79%), Immigrants from Grenada (67.2%, a difference of 1.7%), Navajo (64.8%, a difference of 1.8%), Puerto Rican (68.3%, a difference of 3.5%), and Immigrants from St. Vincent and the Grenadines (68.4%, a difference of 3.6%).
| Demographics | Rating | Rank | In Labor Force | Age 20-24 |
| Yuman | 0.0 /100 | #333 | Tragic 70.3% |
| British West Indians | 0.0 /100 | #334 | Tragic 70.0% |
| Immigrants | Barbados | 0.0 /100 | #335 | Tragic 69.7% |
| Immigrants | Guyana | 0.0 /100 | #336 | Tragic 69.3% |
| Guyanese | 0.0 /100 | #337 | Tragic 69.2% |
| Pima | 0.0 /100 | #338 | Tragic 69.0% |
| Immigrants | Yemen | 0.0 /100 | #339 | Tragic 68.9% |
| Menominee | 0.0 /100 | #340 | Tragic 68.7% |
| Tohono O'odham | 0.0 /100 | #341 | Tragic 68.6% |
| Immigrants | St. Vincent and the Grenadines | 0.0 /100 | #342 | Tragic 68.4% |
| Puerto Ricans | 0.0 /100 | #343 | Tragic 68.3% |
| Immigrants | Grenada | 0.0 /100 | #344 | Tragic 67.2% |
| Hopi | 0.0 /100 | #345 | Tragic 66.0% |
| Lumbee | 0.0 /100 | #346 | Tragic 65.5% |
| Navajo | 0.0 /100 | #347 | Tragic 64.8% |
Demographics Similar to Dutch West Indians by In Labor Force | Age 20-24
In terms of in labor force | age 20-24, the demographic groups most similar to Dutch West Indians are Egyptian (73.7%, a difference of 0.0%), Immigrants from Turkey (73.7%, a difference of 0.030%), Paraguayan (73.7%, a difference of 0.040%), Houma (73.7%, a difference of 0.040%), and Asian (73.7%, a difference of 0.050%).
| Demographics | Rating | Rank | In Labor Force | Age 20-24 |
| Immigrants | Kazakhstan | 1.1 /100 | #252 | Tragic 73.8% |
| Arapaho | 1.0 /100 | #253 | Tragic 73.8% |
| Ute | 1.0 /100 | #254 | Tragic 73.8% |
| Immigrants | Pakistan | 0.9 /100 | #255 | Tragic 73.8% |
| Spanish American Indians | 0.8 /100 | #256 | Tragic 73.7% |
| Paraguayans | 0.8 /100 | #257 | Tragic 73.7% |
| Egyptians | 0.7 /100 | #258 | Tragic 73.7% |
| Dutch West Indians | 0.7 /100 | #259 | Tragic 73.7% |
| Immigrants | Turkey | 0.7 /100 | #260 | Tragic 73.7% |
| Houma | 0.6 /100 | #261 | Tragic 73.7% |
| Asians | 0.6 /100 | #262 | Tragic 73.7% |
| Immigrants | Asia | 0.5 /100 | #263 | Tragic 73.6% |
| Immigrants | Haiti | 0.5 /100 | #264 | Tragic 73.6% |
| Burmese | 0.5 /100 | #265 | Tragic 73.6% |
| Haitians | 0.5 /100 | #266 | Tragic 73.6% |