Immigrants from Sri Lanka vs Argentinean In Labor Force | Age 30-34

COMPARE

Immigrants from Sri Lanka
Race
Ancestry
AfghanAfricanAlaska NativeAlaskan AthabascanAlbanianAleutAlsatianAmericanApacheArabArapahoArmenianAssyrian/Chaldean/SyriacAustralianAustrianBahamianBangladeshiBarbadianBasqueBelgianBelizeanBermudanBhutaneseBlackfeetBolivianBrazilianBritishBritish West IndianBulgarianBurmeseCajunCambodianCanadianCape VerdeanCarpatho RusynCelticCentral AmericanCentral American IndianCherokeeCheyenneChickasawChileanChineseChippewaChoctawColombianColvilleComancheCosta RicanCreeCreekCroatianCrowCubanCypriotCzechCzechoslovakianDanishDelawareDominicanDutchDutch West IndianEastern EuropeanEcuadorianEgyptianEnglishEstonianEthiopianEuropeanFijianFilipinoFinnishFrenchFrench American IndianFrench CanadianGermanGerman RussianGhanaianGreekGuamanian/ChamorroGuatemalanGuyaneseHaitianHmongHonduranHopiHoumaHungarianIcelanderIndian (Asian)IndonesianInupiatIranianIraqiIrishIroquoisIsraeliItalianJamaicanJapaneseJordanianKenyanKiowaKoreanLaotianLatvianLebaneseLiberianLithuanianLumbeeLuxembourgerMacedonianMalaysianMalteseMarshalleseMenomineeMexicanMexican American IndianMongolianMoroccanNative HawaiianNavajoNepaleseNew ZealanderNicaraguanNigerianNorthern EuropeanNorwegianOkinawanOsageOttawaPaiutePakistaniPalestinianPanamanianParaguayanPennsylvania GermanPeruvianPimaPolishPortuguesePotawatomiPuebloPuerto RicanPuget Sound SalishRomanianRussianSalvadoranSamoanScandinavianScotch-IrishScottishSeminoleSenegaleseSerbianShoshoneSierra LeoneanSiouxSlavicSlovakSloveneSomaliSouth AfricanSouth AmericanSouth American IndianSoviet UnionSpaniardSpanishSpanish AmericanSpanish American IndianSri LankanSubsaharan AfricanSudaneseSwedishSwissSyrianTaiwaneseThaiTlingit-HaidaTohono O'OdhamTonganTrinidadian and TobagonianTsimshianTurkishU.S. Virgin IslanderUgandanUkrainianUruguayanUteVenezuelanVietnameseWelshWest IndianYakamaYaquiYugoslavianYumanYup'ikZimbabwean
Immigration
NonimmigrantsImmigrantsAfghanistanAfricaAlbaniaArgentinaArmeniaAsiaAustraliaAustriaBahamasBangladeshBarbadosBelarusBelgiumBelizeBoliviaBosnia and HerzegovinaBrazilBulgariaBurma/MyanmarCabo VerdeCambodiaCameroonCanadaCaribbeanCentral AmericaChileChinaColombiaCongoCosta RicaCroatiaCubaCzechoslovakiaDenmarkDominicaDominican RepublicEastern AfricaEastern AsiaEastern EuropeEcuadorEgyptEl SalvadorEnglandEritreaEthiopiaEuropeFijiFranceGermanyGhanaGreeceGrenadaGuatemalaGuyanaHaitiHondurasHong KongHungaryIndiaIndonesiaIranIraqIrelandIsraelItalyJamaicaJapanJordanKazakhstanKenyaKoreaKuwaitLaosLatin AmericaLatviaLebanonLiberiaLithuaniaMalaysiaMexicoMicronesiaMiddle AfricaMoldovaMoroccoNepalNetherlandsNicaraguaNigeriaNorth AmericaNorth MacedoniaNorthern AfricaNorthern EuropeNorwayOceaniaPakistanPanamaPeruPhilippinesPolandPortugalRomaniaRussiaSaudi ArabiaScotlandSenegalSerbiaSierra LeoneSingaporeSomaliaSouth AfricaSouth AmericaSouth Central AsiaSouth Eastern AsiaSouthern EuropeSpainSri LankaSt. Vincent and the GrenadinesSudanSwedenSwitzerlandSyriaTaiwanThailandTrinidad and TobagoTurkeyUgandaUkraineUruguayUzbekistanVenezuelaVietnamWest IndiesWestern AfricaWestern AsiaWestern EuropeYemenZaireZimbabweAzores
Argentinean
Race
Ancestry
AfghanAfricanAlaska NativeAlaskan AthabascanAlbanianAleutAlsatianAmericanApacheArabArapahoArgentineanArmenianAssyrian/Chaldean/SyriacAustralianAustrianBahamianBangladeshiBarbadianBasqueBelgianBelizeanBermudanBhutaneseBlackfeetBolivianBrazilianBritishBritish West IndianBulgarianBurmeseCajunCambodianCanadianCape VerdeanCarpatho RusynCelticCentral AmericanCentral American IndianCherokeeCheyenneChickasawChileanChineseChippewaChoctawColombianColvilleComancheCosta RicanCreeCreekCroatianCrowCubanCypriotCzechCzechoslovakianDanishDelawareDominicanDutchDutch West IndianEastern EuropeanEcuadorianEgyptianEnglishEstonianEthiopianEuropeanFijianFilipinoFinnishFrenchFrench American IndianFrench CanadianGermanGerman RussianGhanaianGreekGuamanian/ChamorroGuatemalanGuyaneseHaitianHmongHonduranHopiHoumaHungarianIcelanderIndian (Asian)IndonesianInupiatIranianIraqiIrishIroquoisIsraeliItalianJamaicanJapaneseJordanianKenyanKiowaKoreanLaotianLatvianLebaneseLiberianLithuanianLumbeeLuxembourgerMacedonianMalaysianMalteseMarshalleseMenomineeMexicanMexican American IndianMongolianMoroccanNative HawaiianNavajoNepaleseNew ZealanderNicaraguanNigerianNorthern EuropeanNorwegianOkinawanOsageOttawaPaiutePakistaniPalestinianPanamanianParaguayanPennsylvania GermanPeruvianPimaPolishPortuguesePotawatomiPuebloPuerto RicanPuget Sound SalishRomanianRussianSalvadoranSamoanScandinavianScotch-IrishScottishSeminoleSenegaleseSerbianShoshoneSierra LeoneanSiouxSlavicSlovakSloveneSomaliSouth AfricanSouth AmericanSouth American IndianSoviet UnionSpaniardSpanishSpanish AmericanSpanish American IndianSri LankanSubsaharan AfricanSudaneseSwedishSwissSyrianTaiwaneseThaiTlingit-HaidaTohono O'OdhamTonganTrinidadian and TobagonianTsimshianTurkishU.S. Virgin IslanderUgandanUkrainianUruguayanUteVenezuelanVietnameseWelshWest IndianYakamaYaquiYugoslavianYumanYup'ikZimbabwean
Immigration
NonimmigrantsImmigrantsAfghanistanAfricaAlbaniaArgentinaArmeniaAsiaAustraliaAustriaBahamasBangladeshBarbadosBelarusBelgiumBelizeBoliviaBosnia and HerzegovinaBrazilBulgariaBurma/MyanmarCabo VerdeCambodiaCameroonCanadaCaribbeanCentral AmericaChileChinaColombiaCongoCosta RicaCroatiaCubaCzechoslovakiaDenmarkDominicaDominican RepublicEastern AfricaEastern AsiaEastern EuropeEcuadorEgyptEl SalvadorEnglandEritreaEthiopiaEuropeFijiFranceGermanyGhanaGreeceGrenadaGuatemalaGuyanaHaitiHondurasHong KongHungaryIndiaIndonesiaIranIraqIrelandIsraelItalyJamaicaJapanJordanKazakhstanKenyaKoreaKuwaitLaosLatin AmericaLatviaLebanonLiberiaLithuaniaMalaysiaMexicoMicronesiaMiddle AfricaMoldovaMoroccoNepalNetherlandsNicaraguaNigeriaNorth AmericaNorth MacedoniaNorthern AfricaNorthern EuropeNorwayOceaniaPakistanPanamaPeruPhilippinesPolandPortugalRomaniaRussiaSaudi ArabiaScotlandSenegalSerbiaSierra LeoneSingaporeSomaliaSouth AfricaSouth AmericaSouth Central AsiaSouth Eastern AsiaSouthern EuropeSpainSt. Vincent and the GrenadinesSudanSwedenSwitzerlandSyriaTaiwanThailandTrinidad and TobagoTurkeyUgandaUkraineUruguayUzbekistanVenezuelaVietnamWest IndiesWestern AfricaWestern AsiaWestern EuropeYemenZaireZimbabweAzores
In Labor Force | Age 30-34
Income
Poverty
Unemployment
Labor Participation
Family Structure
Vehicle Availability
Education Level
Disability

In Labor Force | Age 30-34 Comparison

Immigrants from Sri Lanka

Argentineans

Exceptional
Exceptional
85.6%
IN LABOR FORCE | AGE 30-34
99.8/ 100
METRIC RATING
44th/ 347
METRIC RANK
85.1%
IN LABOR FORCE | AGE 30-34
95.8/ 100
METRIC RATING
109th/ 347
METRIC RANK

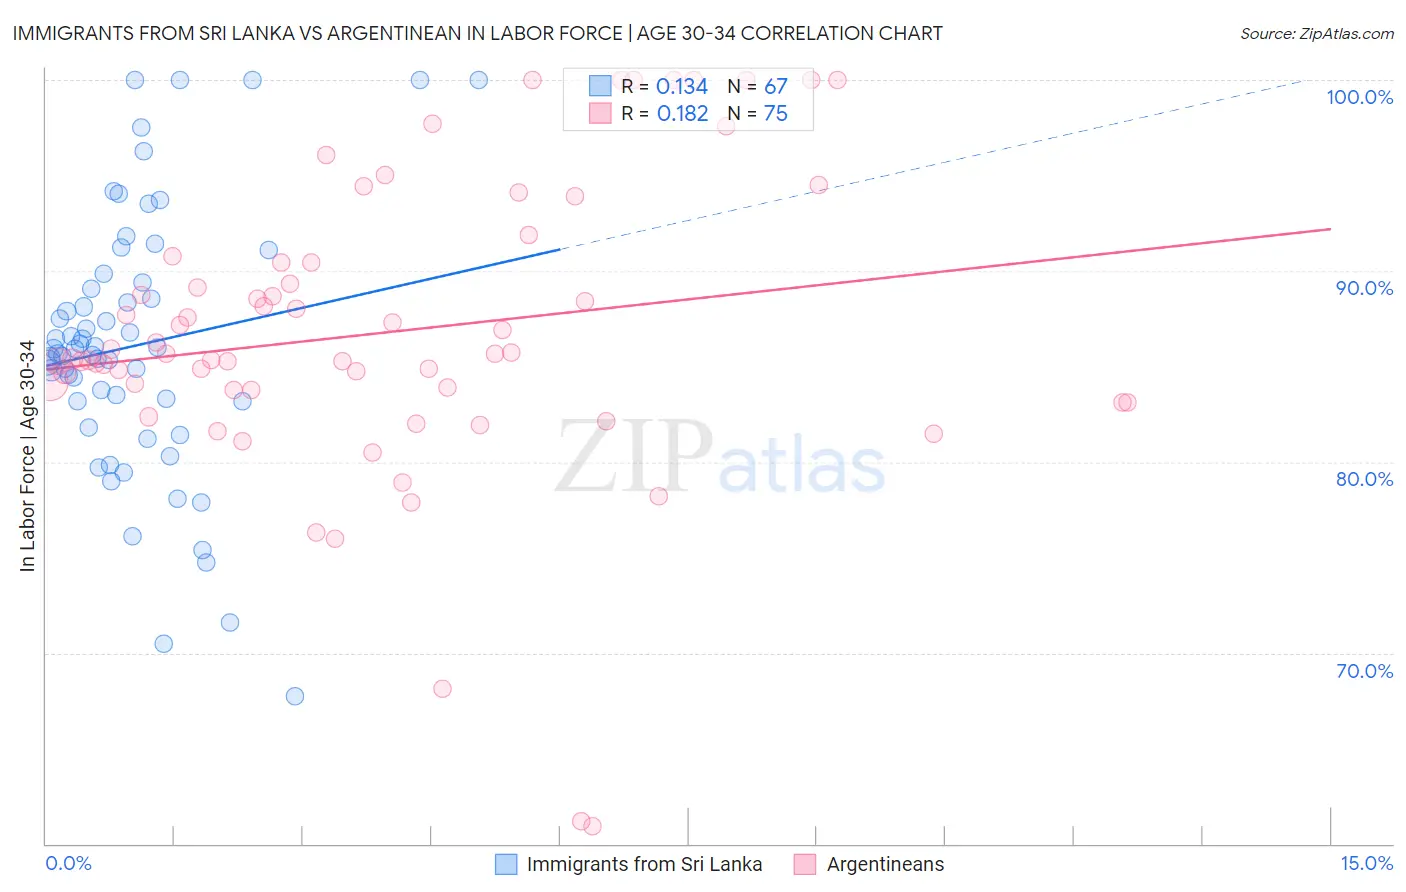
Immigrants from Sri Lanka vs Argentinean In Labor Force | Age 30-34 Correlation Chart

The statistical analysis conducted on geographies consisting of 149,680,449 people shows a poor positive correlation between the proportion of Immigrants from Sri Lanka and labor force participation rate among population between the ages 30 and 34 in the United States with a correlation coefficient (R) of 0.134 and weighted average of 85.6%. Similarly, the statistical analysis conducted on geographies consisting of 297,011,031 people shows a poor positive correlation between the proportion of Argentineans and labor force participation rate among population between the ages 30 and 34 in the United States with a correlation coefficient (R) of 0.182 and weighted average of 85.1%, a difference of 0.56%.
Immigrants from Sri Lanka vs Argentinean In Labor Force | Age 30-34

In Labor Force | Age 30-34 Correlation Summary

MeasurementImmigrants from Sri LankaArgentinean
Minimum67.7%60.9%
Maximum100.0%100.0%
Range32.3%39.1%
Mean86.1%86.8%
Median85.9%85.7%
Interquartile 25% (IQ1)83.2%83.7%
Interquartile 75% (IQ3)89.4%90.4%
Interquartile Range (IQR)6.2%6.7%
Standard Deviation (Sample)7.0%7.8%
Standard Deviation (Population)6.9%7.8%

Similar Demographics by In Labor Force | Age 30-34

Demographics Similar to Immigrants from Sri Lanka by In Labor Force | Age 30-34

In terms of in labor force | age 30-34, the demographic groups most similar to Immigrants from Sri Lanka are Immigrants from Nepal (85.6%, a difference of 0.010%), Immigrants from Morocco (85.6%, a difference of 0.010%), Croatian (85.6%, a difference of 0.010%), Zimbabwean (85.6%, a difference of 0.030%), and Immigrants from Lithuania (85.6%, a difference of 0.030%).
DemographicsRating | RankIn Labor Force | Age 30-34
Norwegians
99.9
/100
|
#37
Exceptional
85.7%
Immigrants | Greece
99.9
/100
|
#38
Exceptional
85.7%
Eastern Europeans
99.9
/100
|
#39
Exceptional
85.7%
Turks
99.9
/100
|
#40
Exceptional
85.7%
Immigrants | Italy
99.9
/100
|
#41
Exceptional
85.7%
Zimbabweans
99.8
/100
|
#42
Exceptional
85.6%
Immigrants | Lithuania
99.8
/100
|
#43
Exceptional
85.6%
Immigrants | Sri Lanka
99.8
/100
|
#44
Exceptional
85.6%
Immigrants | Nepal
99.8
/100
|
#45
Exceptional
85.6%
Immigrants | Morocco
99.8
/100
|
#46
Exceptional
85.6%
Croatians
99.8
/100
|
#47
Exceptional
85.6%
Immigrants | Sweden
99.8
/100
|
#48
Exceptional
85.6%
Lithuanians
99.8
/100
|
#49
Exceptional
85.6%
Immigrants | Australia
99.8
/100
|
#50
Exceptional
85.6%
Cape Verdeans
99.7
/100
|
#51
Exceptional
85.6%

Demographics Similar to Argentineans by In Labor Force | Age 30-34

In terms of in labor force | age 30-34, the demographic groups most similar to Argentineans are Immigrants from Zimbabwe (85.1%, a difference of 0.0%), Immigrants from Northern Africa (85.2%, a difference of 0.020%), Immigrants from South Africa (85.1%, a difference of 0.020%), Alsatian (85.2%, a difference of 0.030%), and Immigrants from Middle Africa (85.2%, a difference of 0.030%).
DemographicsRating | RankIn Labor Force | Age 30-34
Immigrants | Austria
96.8
/100
|
#102
Exceptional
85.2%
Ukrainians
96.6
/100
|
#103
Exceptional
85.2%
Immigrants | Ghana
96.5
/100
|
#104
Exceptional
85.2%
Alsatians
96.3
/100
|
#105
Exceptional
85.2%
Immigrants | Middle Africa
96.3
/100
|
#106
Exceptional
85.2%
Immigrants | Northern Africa
96.3
/100
|
#107
Exceptional
85.2%
Immigrants | Zimbabwe
95.8
/100
|
#108
Exceptional
85.1%
Argentineans
95.8
/100
|
#109
Exceptional
85.1%
Immigrants | South Africa
95.3
/100
|
#110
Exceptional
85.1%
Immigrants | Scotland
94.9
/100
|
#111
Exceptional
85.1%
Immigrants | Hungary
94.8
/100
|
#112
Exceptional
85.1%
Immigrants | Romania
94.7
/100
|
#113
Exceptional
85.1%
Yugoslavians
94.7
/100
|
#114
Exceptional
85.1%
Immigrants | South Central Asia
94.6
/100
|
#115
Exceptional
85.1%
Egyptians
94.5
/100
|
#116
Exceptional
85.1%