Immigrants from Spain vs Scandinavian In Labor Force | Age 30-34

COMPARE

Immigrants from Spain
Race
Ancestry
AfghanAfricanAlaska NativeAlaskan AthabascanAlbanianAleutAlsatianAmericanApacheArabArapahoArgentineanArmenianAssyrian/Chaldean/SyriacAustralianAustrianBahamianBangladeshiBarbadianBasqueBelgianBelizeanBermudanBhutaneseBlackfeetBolivianBrazilianBritishBritish West IndianBulgarianBurmeseCajunCambodianCanadianCape VerdeanCarpatho RusynCelticCentral AmericanCentral American IndianCherokeeCheyenneChickasawChileanChineseChippewaChoctawColombianColvilleComancheCosta RicanCreeCreekCroatianCrowCubanCypriotCzechCzechoslovakianDanishDelawareDominicanDutchDutch West IndianEastern EuropeanEcuadorianEgyptianEnglishEstonianEthiopianEuropeanFijianFilipinoFinnishFrenchFrench American IndianFrench CanadianGermanGerman RussianGhanaianGreekGuamanian/ChamorroGuatemalanGuyaneseHaitianHmongHonduranHopiHoumaHungarianIcelanderIndian (Asian)IndonesianInupiatIranianIraqiIrishIroquoisIsraeliItalianJamaicanJapaneseJordanianKenyanKiowaKoreanLaotianLatvianLebaneseLiberianLithuanianLumbeeLuxembourgerMacedonianMalaysianMalteseMarshalleseMenomineeMexicanMexican American IndianMongolianMoroccanNative HawaiianNavajoNepaleseNew ZealanderNicaraguanNigerianNorthern EuropeanNorwegianOkinawanOsageOttawaPaiutePakistaniPalestinianPanamanianParaguayanPennsylvania GermanPeruvianPimaPolishPortuguesePotawatomiPuebloPuerto RicanPuget Sound SalishRomanianRussianSalvadoranSamoanScotch-IrishScottishSeminoleSenegaleseSerbianShoshoneSierra LeoneanSiouxSlavicSlovakSloveneSomaliSouth AfricanSouth AmericanSouth American IndianSoviet UnionSpaniardSpanishSpanish AmericanSpanish American IndianSri LankanSubsaharan AfricanSudaneseSwedishSwissSyrianTaiwaneseThaiTlingit-HaidaTohono O'OdhamTonganTrinidadian and TobagonianTsimshianTurkishU.S. Virgin IslanderUgandanUkrainianUruguayanUteVenezuelanVietnameseWelshWest IndianYakamaYaquiYugoslavianYumanYup'ikZimbabwean
Immigration
NonimmigrantsImmigrantsAfghanistanAfricaAlbaniaArgentinaArmeniaAsiaAustraliaAustriaBahamasBangladeshBarbadosBelarusBelgiumBelizeBoliviaBosnia and HerzegovinaBrazilBulgariaBurma/MyanmarCabo VerdeCambodiaCameroonCanadaCaribbeanCentral AmericaChileChinaColombiaCongoCosta RicaCroatiaCubaCzechoslovakiaDenmarkDominicaDominican RepublicEastern AfricaEastern AsiaEastern EuropeEcuadorEgyptEl SalvadorEnglandEritreaEthiopiaEuropeFijiFranceGermanyGhanaGreeceGrenadaGuatemalaGuyanaHaitiHondurasHong KongHungaryIndiaIndonesiaIranIraqIrelandIsraelItalyJamaicaJapanJordanKazakhstanKenyaKoreaKuwaitLaosLatin AmericaLatviaLebanonLiberiaLithuaniaMalaysiaMexicoMicronesiaMiddle AfricaMoldovaMoroccoNepalNetherlandsNicaraguaNigeriaNorth AmericaNorth MacedoniaNorthern AfricaNorthern EuropeNorwayOceaniaPakistanPanamaPeruPhilippinesPolandPortugalRomaniaRussiaSaudi ArabiaScotlandSenegalSerbiaSierra LeoneSingaporeSomaliaSouth AfricaSouth AmericaSouth Central AsiaSouth Eastern AsiaSouthern EuropeSpainSri LankaSt. Vincent and the GrenadinesSudanSwedenSwitzerlandSyriaTaiwanThailandTrinidad and TobagoTurkeyUgandaUkraineUruguayUzbekistanVenezuelaVietnamWest IndiesWestern AfricaWestern AsiaWestern EuropeYemenZaireZimbabweAzores
Scandinavian
Race
Ancestry
AfghanAfricanAlaska NativeAlaskan AthabascanAlbanianAleutAlsatianAmericanApacheArabArapahoArgentineanArmenianAssyrian/Chaldean/SyriacAustralianAustrianBahamianBangladeshiBarbadianBasqueBelgianBelizeanBermudanBhutaneseBlackfeetBolivianBrazilianBritishBritish West IndianBulgarianBurmeseCajunCambodianCanadianCape VerdeanCarpatho RusynCelticCentral AmericanCentral American IndianCherokeeCheyenneChickasawChileanChineseChippewaChoctawColombianColvilleComancheCosta RicanCreeCreekCroatianCrowCubanCypriotCzechCzechoslovakianDanishDelawareDominicanDutchDutch West IndianEastern EuropeanEcuadorianEgyptianEnglishEstonianEthiopianEuropeanFijianFilipinoFinnishFrenchFrench American IndianFrench CanadianGermanGerman RussianGhanaianGreekGuamanian/ChamorroGuatemalanGuyaneseHaitianHmongHonduranHopiHoumaHungarianIcelanderIndian (Asian)IndonesianInupiatIranianIraqiIrishIroquoisIsraeliItalianJamaicanJapaneseJordanianKenyanKiowaKoreanLaotianLatvianLebaneseLiberianLithuanianLumbeeLuxembourgerMacedonianMalaysianMalteseMarshalleseMenomineeMexicanMexican American IndianMongolianMoroccanNative HawaiianNavajoNepaleseNew ZealanderNicaraguanNigerianNorthern EuropeanNorwegianOkinawanOsageOttawaPaiutePakistaniPalestinianPanamanianParaguayanPennsylvania GermanPeruvianPimaPolishPortuguesePotawatomiPuebloPuerto RicanPuget Sound SalishRomanianRussianSalvadoranSamoanScandinavianScotch-IrishScottishSeminoleSenegaleseSerbianShoshoneSierra LeoneanSiouxSlavicSlovakSloveneSomaliSouth AfricanSouth AmericanSouth American IndianSoviet UnionSpaniardSpanishSpanish AmericanSpanish American IndianSri LankanSubsaharan AfricanSudaneseSwedishSwissSyrianTaiwaneseThaiTlingit-HaidaTohono O'OdhamTonganTrinidadian and TobagonianTsimshianTurkishU.S. Virgin IslanderUgandanUkrainianUruguayanUteVenezuelanVietnameseWelshWest IndianYakamaYaquiYugoslavianYumanYup'ikZimbabwean
Immigration
NonimmigrantsImmigrantsAfghanistanAfricaAlbaniaArgentinaArmeniaAsiaAustraliaAustriaBahamasBangladeshBarbadosBelarusBelgiumBelizeBoliviaBosnia and HerzegovinaBrazilBulgariaBurma/MyanmarCabo VerdeCambodiaCameroonCanadaCaribbeanCentral AmericaChileChinaColombiaCongoCosta RicaCroatiaCubaCzechoslovakiaDenmarkDominicaDominican RepublicEastern AfricaEastern AsiaEastern EuropeEcuadorEgyptEl SalvadorEnglandEritreaEthiopiaEuropeFijiFranceGermanyGhanaGreeceGrenadaGuatemalaGuyanaHaitiHondurasHong KongHungaryIndiaIndonesiaIranIraqIrelandIsraelItalyJamaicaJapanJordanKazakhstanKenyaKoreaKuwaitLaosLatin AmericaLatviaLebanonLiberiaLithuaniaMalaysiaMexicoMicronesiaMiddle AfricaMoldovaMoroccoNepalNetherlandsNicaraguaNigeriaNorth AmericaNorth MacedoniaNorthern AfricaNorthern EuropeNorwayOceaniaPakistanPanamaPeruPhilippinesPolandPortugalRomaniaRussiaSaudi ArabiaScotlandSenegalSerbiaSierra LeoneSingaporeSomaliaSouth AfricaSouth AmericaSouth Central AsiaSouth Eastern AsiaSouthern EuropeSri LankaSt. Vincent and the GrenadinesSudanSwedenSwitzerlandSyriaTaiwanThailandTrinidad and TobagoTurkeyUgandaUkraineUruguayUzbekistanVenezuelaVietnamWest IndiesWestern AfricaWestern AsiaWestern EuropeYemenZaireZimbabweAzores
In Labor Force | Age 30-34
Income
Poverty
Unemployment
Labor Participation
Family Structure
Vehicle Availability
Education Level
Disability

In Labor Force | Age 30-34 Comparison

Immigrants from Spain

Scandinavians

Exceptional
Fair
85.0%
IN LABOR FORCE | AGE 30-34
90.0/ 100
METRIC RATING
130th/ 347
METRIC RANK
84.5%
IN LABOR FORCE | AGE 30-34
24.7/ 100
METRIC RATING
192nd/ 347
METRIC RANK

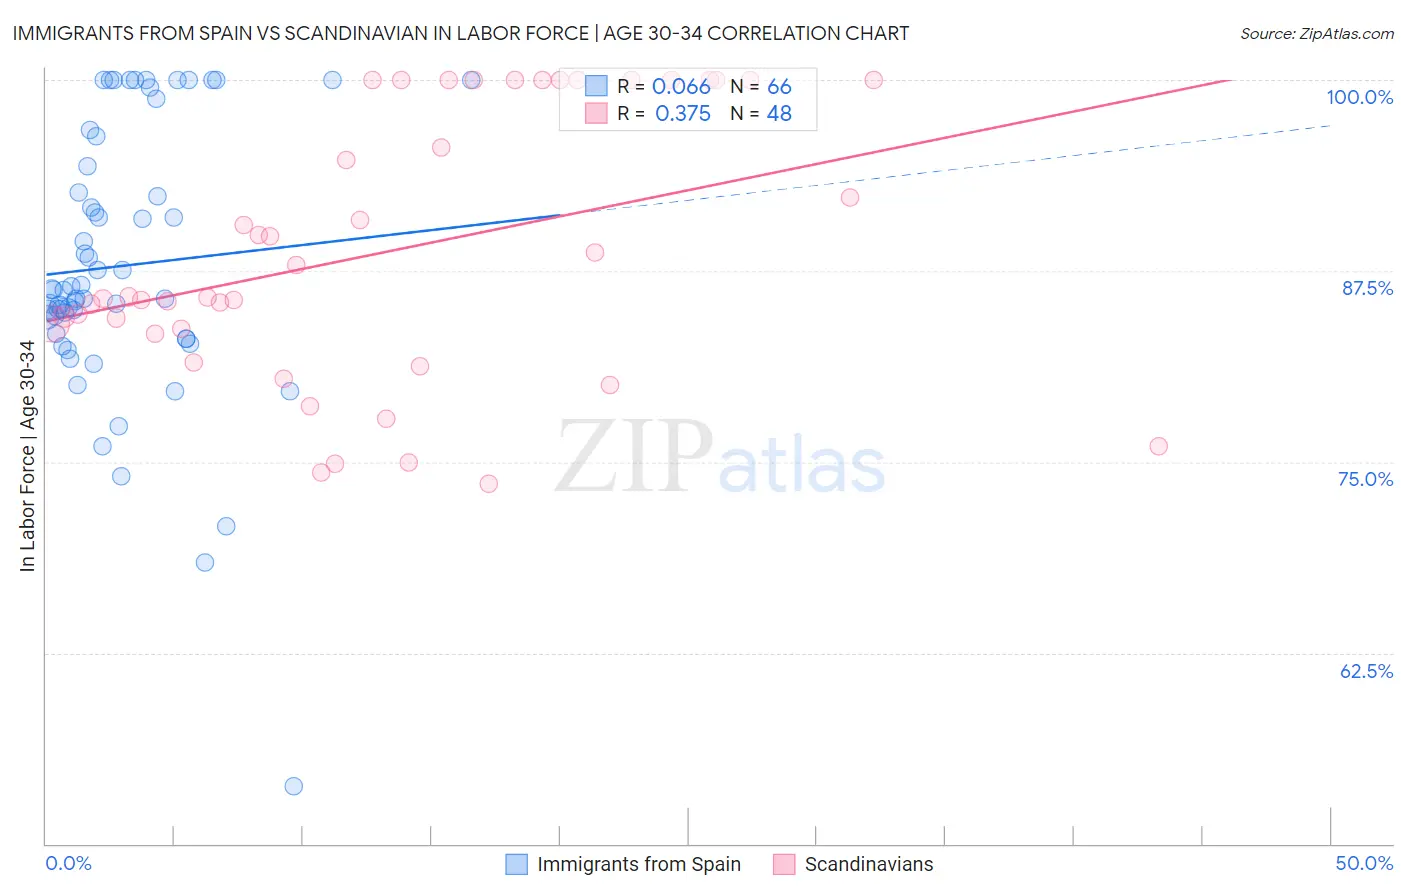
Immigrants from Spain vs Scandinavian In Labor Force | Age 30-34 Correlation Chart

The statistical analysis conducted on geographies consisting of 239,607,955 people shows a slight positive correlation between the proportion of Immigrants from Spain and labor force participation rate among population between the ages 30 and 34 in the United States with a correlation coefficient (R) of 0.066 and weighted average of 85.0%. Similarly, the statistical analysis conducted on geographies consisting of 472,088,741 people shows a mild positive correlation between the proportion of Scandinavians and labor force participation rate among population between the ages 30 and 34 in the United States with a correlation coefficient (R) of 0.375 and weighted average of 84.5%, a difference of 0.58%.
Immigrants from Spain vs Scandinavian In Labor Force | Age 30-34

In Labor Force | Age 30-34 Correlation Summary

MeasurementImmigrants from SpainScandinavian
Minimum53.8%73.6%
Maximum100.0%100.0%
Range46.2%26.4%
Mean87.8%88.8%
Median86.3%85.8%
Interquartile 25% (IQ1)83.4%83.5%
Interquartile 75% (IQ3)94.3%100.0%
Interquartile Range (IQR)10.9%16.5%
Standard Deviation (Sample)8.9%8.7%
Standard Deviation (Population)8.8%8.6%

Similar Demographics by In Labor Force | Age 30-34

Demographics Similar to Immigrants from Spain by In Labor Force | Age 30-34

In terms of in labor force | age 30-34, the demographic groups most similar to Immigrants from Spain are Immigrants from Western Africa (85.0%, a difference of 0.0%), Slavic (85.0%, a difference of 0.010%), Immigrants from Argentina (85.0%, a difference of 0.010%), Chinese (85.0%, a difference of 0.010%), and Immigrants from Israel (85.0%, a difference of 0.010%).
DemographicsRating | RankIn Labor Force | Age 30-34
Armenians
92.2
/100
|
#123
Exceptional
85.0%
Australians
92.0
/100
|
#124
Exceptional
85.0%
Immigrants | Jordan
91.5
/100
|
#125
Exceptional
85.0%
Austrians
90.9
/100
|
#126
Exceptional
85.0%
Slavs
90.7
/100
|
#127
Exceptional
85.0%
Immigrants | Argentina
90.6
/100
|
#128
Exceptional
85.0%
Immigrants | Western Africa
90.2
/100
|
#129
Exceptional
85.0%
Immigrants | Spain
90.0
/100
|
#130
Exceptional
85.0%
Chinese
89.6
/100
|
#131
Excellent
85.0%
Immigrants | Israel
89.5
/100
|
#132
Excellent
85.0%
New Zealanders
89.5
/100
|
#133
Excellent
85.0%
Immigrants | Chile
89.2
/100
|
#134
Excellent
85.0%
Immigrants | Asia
88.9
/100
|
#135
Excellent
85.0%
Jordanians
88.6
/100
|
#136
Excellent
85.0%
South Africans
88.0
/100
|
#137
Excellent
85.0%

Demographics Similar to Scandinavians by In Labor Force | Age 30-34

In terms of in labor force | age 30-34, the demographic groups most similar to Scandinavians are Hungarian (84.5%, a difference of 0.0%), Immigrants from Zaire (84.5%, a difference of 0.010%), Immigrants from Costa Rica (84.5%, a difference of 0.010%), Immigrants from Afghanistan (84.5%, a difference of 0.010%), and Korean (84.5%, a difference of 0.010%).
DemographicsRating | RankIn Labor Force | Age 30-34
Immigrants | Philippines
31.5
/100
|
#185
Fair
84.6%
Immigrants | Congo
29.7
/100
|
#186
Fair
84.6%
Costa Ricans
29.6
/100
|
#187
Fair
84.6%
Taiwanese
29.4
/100
|
#188
Fair
84.6%
Nigerians
28.9
/100
|
#189
Fair
84.5%
Immigrants | Zaire
25.8
/100
|
#190
Fair
84.5%
Hungarians
24.8
/100
|
#191
Fair
84.5%
Scandinavians
24.7
/100
|
#192
Fair
84.5%
Immigrants | Costa Rica
23.9
/100
|
#193
Fair
84.5%
Immigrants | Afghanistan
23.5
/100
|
#194
Fair
84.5%
Koreans
23.2
/100
|
#195
Fair
84.5%
British
22.9
/100
|
#196
Fair
84.5%
Immigrants | Syria
21.9
/100
|
#197
Fair
84.5%
Dutch
20.2
/100
|
#198
Fair
84.5%
Immigrants | Thailand
19.1
/100
|
#199
Poor
84.5%