Immigrants from Scotland vs Palestinian In Labor Force | Age 30-34

COMPARE

Immigrants from Scotland
Race
Ancestry
AfghanAfricanAlaska NativeAlaskan AthabascanAlbanianAleutAlsatianAmericanApacheArabArapahoArgentineanArmenianAssyrian/Chaldean/SyriacAustralianAustrianBahamianBangladeshiBarbadianBasqueBelgianBelizeanBermudanBhutaneseBlackfeetBolivianBrazilianBritishBritish West IndianBulgarianBurmeseCajunCambodianCanadianCape VerdeanCarpatho RusynCelticCentral AmericanCentral American IndianCherokeeCheyenneChickasawChileanChineseChippewaChoctawColombianColvilleComancheCosta RicanCreeCreekCroatianCrowCubanCypriotCzechCzechoslovakianDanishDelawareDominicanDutchDutch West IndianEastern EuropeanEcuadorianEgyptianEnglishEstonianEthiopianEuropeanFijianFilipinoFinnishFrenchFrench American IndianFrench CanadianGermanGerman RussianGhanaianGreekGuamanian/ChamorroGuatemalanGuyaneseHaitianHmongHonduranHopiHoumaHungarianIcelanderIndian (Asian)IndonesianInupiatIranianIraqiIrishIroquoisIsraeliItalianJamaicanJapaneseJordanianKenyanKiowaKoreanLaotianLatvianLebaneseLiberianLithuanianLumbeeLuxembourgerMacedonianMalaysianMalteseMarshalleseMenomineeMexicanMexican American IndianMongolianMoroccanNative HawaiianNavajoNepaleseNew ZealanderNicaraguanNigerianNorthern EuropeanNorwegianOkinawanOsageOttawaPaiutePakistaniPanamanianParaguayanPennsylvania GermanPeruvianPimaPolishPortuguesePotawatomiPuebloPuerto RicanPuget Sound SalishRomanianRussianSalvadoranSamoanScandinavianScotch-IrishScottishSeminoleSenegaleseSerbianShoshoneSierra LeoneanSiouxSlavicSlovakSloveneSomaliSouth AfricanSouth AmericanSouth American IndianSoviet UnionSpaniardSpanishSpanish AmericanSpanish American IndianSri LankanSubsaharan AfricanSudaneseSwedishSwissSyrianTaiwaneseThaiTlingit-HaidaTohono O'OdhamTonganTrinidadian and TobagonianTsimshianTurkishU.S. Virgin IslanderUgandanUkrainianUruguayanUteVenezuelanVietnameseWelshWest IndianYakamaYaquiYugoslavianYumanYup'ikZimbabwean
Immigration
NonimmigrantsImmigrantsAfghanistanAfricaAlbaniaArgentinaArmeniaAsiaAustraliaAustriaBahamasBangladeshBarbadosBelarusBelgiumBelizeBoliviaBosnia and HerzegovinaBrazilBulgariaBurma/MyanmarCabo VerdeCambodiaCameroonCanadaCaribbeanCentral AmericaChileChinaColombiaCongoCosta RicaCroatiaCubaCzechoslovakiaDenmarkDominicaDominican RepublicEastern AfricaEastern AsiaEastern EuropeEcuadorEgyptEl SalvadorEnglandEritreaEthiopiaEuropeFijiFranceGermanyGhanaGreeceGrenadaGuatemalaGuyanaHaitiHondurasHong KongHungaryIndiaIndonesiaIranIraqIrelandIsraelItalyJamaicaJapanJordanKazakhstanKenyaKoreaKuwaitLaosLatin AmericaLatviaLebanonLiberiaLithuaniaMalaysiaMexicoMicronesiaMiddle AfricaMoldovaMoroccoNepalNetherlandsNicaraguaNigeriaNorth AmericaNorth MacedoniaNorthern AfricaNorthern EuropeNorwayOceaniaPakistanPanamaPeruPhilippinesPolandPortugalRomaniaRussiaSaudi ArabiaScotlandSenegalSerbiaSierra LeoneSingaporeSomaliaSouth AfricaSouth AmericaSouth Central AsiaSouth Eastern AsiaSouthern EuropeSpainSri LankaSt. Vincent and the GrenadinesSudanSwedenSwitzerlandSyriaTaiwanThailandTrinidad and TobagoTurkeyUgandaUkraineUruguayUzbekistanVenezuelaVietnamWest IndiesWestern AfricaWestern AsiaWestern EuropeYemenZaireZimbabweAzores
Palestinian
Race
Ancestry
AfghanAfricanAlaska NativeAlaskan AthabascanAlbanianAleutAlsatianAmericanApacheArabArapahoArgentineanArmenianAssyrian/Chaldean/SyriacAustralianAustrianBahamianBangladeshiBarbadianBasqueBelgianBelizeanBermudanBhutaneseBlackfeetBolivianBrazilianBritishBritish West IndianBulgarianBurmeseCajunCambodianCanadianCape VerdeanCarpatho RusynCelticCentral AmericanCentral American IndianCherokeeCheyenneChickasawChileanChineseChippewaChoctawColombianColvilleComancheCosta RicanCreeCreekCroatianCrowCubanCypriotCzechCzechoslovakianDanishDelawareDominicanDutchDutch West IndianEastern EuropeanEcuadorianEgyptianEnglishEstonianEthiopianEuropeanFijianFilipinoFinnishFrenchFrench American IndianFrench CanadianGermanGerman RussianGhanaianGreekGuamanian/ChamorroGuatemalanGuyaneseHaitianHmongHonduranHopiHoumaHungarianIcelanderIndian (Asian)IndonesianInupiatIranianIraqiIrishIroquoisIsraeliItalianJamaicanJapaneseJordanianKenyanKiowaKoreanLaotianLatvianLebaneseLiberianLithuanianLumbeeLuxembourgerMacedonianMalaysianMalteseMarshalleseMenomineeMexicanMexican American IndianMongolianMoroccanNative HawaiianNavajoNepaleseNew ZealanderNicaraguanNigerianNorthern EuropeanNorwegianOkinawanOsageOttawaPaiutePakistaniPalestinianPanamanianParaguayanPennsylvania GermanPeruvianPimaPolishPortuguesePotawatomiPuebloPuerto RicanPuget Sound SalishRomanianRussianSalvadoranSamoanScandinavianScotch-IrishScottishSeminoleSenegaleseSerbianShoshoneSierra LeoneanSiouxSlavicSlovakSloveneSomaliSouth AfricanSouth AmericanSouth American IndianSoviet UnionSpaniardSpanishSpanish AmericanSpanish American IndianSri LankanSubsaharan AfricanSudaneseSwedishSwissSyrianTaiwaneseThaiTlingit-HaidaTohono O'OdhamTonganTrinidadian and TobagonianTsimshianTurkishU.S. Virgin IslanderUgandanUkrainianUruguayanUteVenezuelanVietnameseWelshWest IndianYakamaYaquiYugoslavianYumanYup'ikZimbabwean
Immigration
NonimmigrantsImmigrantsAfghanistanAfricaAlbaniaArgentinaArmeniaAsiaAustraliaAustriaBahamasBangladeshBarbadosBelarusBelgiumBelizeBoliviaBosnia and HerzegovinaBrazilBulgariaBurma/MyanmarCabo VerdeCambodiaCameroonCanadaCaribbeanCentral AmericaChileChinaColombiaCongoCosta RicaCroatiaCubaCzechoslovakiaDenmarkDominicaDominican RepublicEastern AfricaEastern AsiaEastern EuropeEcuadorEgyptEl SalvadorEnglandEritreaEthiopiaEuropeFijiFranceGermanyGhanaGreeceGrenadaGuatemalaGuyanaHaitiHondurasHong KongHungaryIndiaIndonesiaIranIraqIrelandIsraelItalyJamaicaJapanJordanKazakhstanKenyaKoreaKuwaitLaosLatin AmericaLatviaLebanonLiberiaLithuaniaMalaysiaMexicoMicronesiaMiddle AfricaMoldovaMoroccoNepalNetherlandsNicaraguaNigeriaNorth AmericaNorth MacedoniaNorthern AfricaNorthern EuropeNorwayOceaniaPakistanPanamaPeruPhilippinesPolandPortugalRomaniaRussiaSaudi ArabiaSenegalSerbiaSierra LeoneSingaporeSomaliaSouth AfricaSouth AmericaSouth Central AsiaSouth Eastern AsiaSouthern EuropeSpainSri LankaSt. Vincent and the GrenadinesSudanSwedenSwitzerlandSyriaTaiwanThailandTrinidad and TobagoTurkeyUgandaUkraineUruguayUzbekistanVenezuelaVietnamWest IndiesWestern AfricaWestern AsiaWestern EuropeYemenZaireZimbabweAzores
In Labor Force | Age 30-34
Income
Poverty
Unemployment
Labor Participation
Family Structure
Vehicle Availability
Education Level
Disability

In Labor Force | Age 30-34 Comparison

Immigrants from Scotland

Palestinians

Exceptional
Good
85.1%
IN LABOR FORCE | AGE 30-34
94.9/ 100
METRIC RATING
111th/ 347
METRIC RANK
84.9%
IN LABOR FORCE | AGE 30-34
77.7/ 100
METRIC RATING
145th/ 347
METRIC RANK

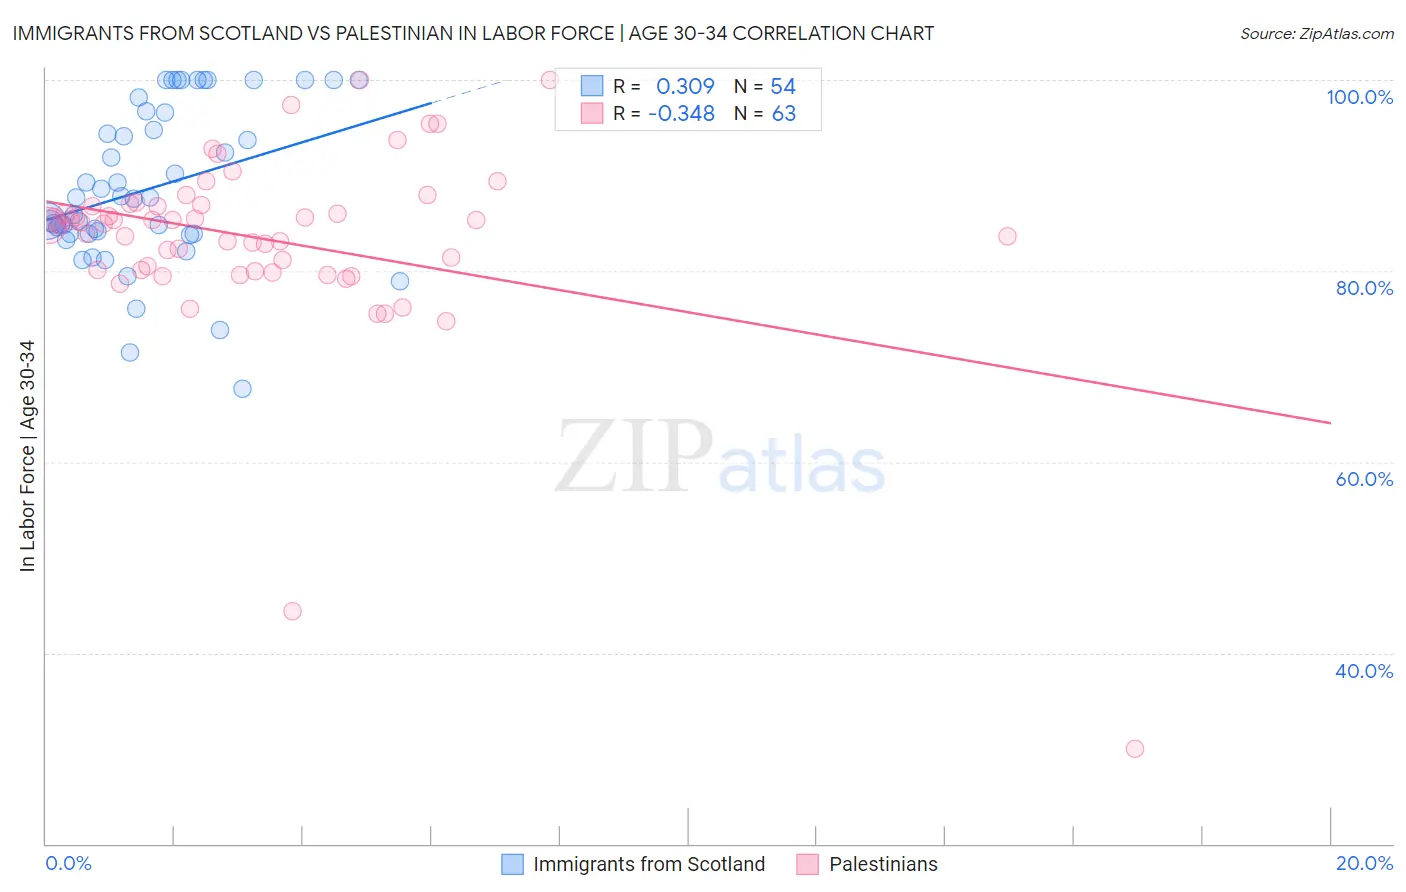
Immigrants from Scotland vs Palestinian In Labor Force | Age 30-34 Correlation Chart

The statistical analysis conducted on geographies consisting of 196,354,267 people shows a mild positive correlation between the proportion of Immigrants from Scotland and labor force participation rate among population between the ages 30 and 34 in the United States with a correlation coefficient (R) of 0.309 and weighted average of 85.1%. Similarly, the statistical analysis conducted on geographies consisting of 216,407,612 people shows a mild negative correlation between the proportion of Palestinians and labor force participation rate among population between the ages 30 and 34 in the United States with a correlation coefficient (R) of -0.348 and weighted average of 84.9%, a difference of 0.29%.
Immigrants from Scotland vs Palestinian In Labor Force | Age 30-34

In Labor Force | Age 30-34 Correlation Summary

MeasurementImmigrants from ScotlandPalestinian
Minimum67.7%30.0%
Maximum100.0%100.0%
Range32.3%70.0%
Mean88.6%83.4%
Median87.6%84.9%
Interquartile 25% (IQ1)83.9%80.1%
Interquartile 75% (IQ3)96.5%86.9%
Interquartile Range (IQR)12.7%6.8%
Standard Deviation (Sample)8.2%10.2%
Standard Deviation (Population)8.1%10.1%

Similar Demographics by In Labor Force | Age 30-34

Demographics Similar to Immigrants from Scotland by In Labor Force | Age 30-34

In terms of in labor force | age 30-34, the demographic groups most similar to Immigrants from Scotland are Immigrants from Hungary (85.1%, a difference of 0.0%), Immigrants from Romania (85.1%, a difference of 0.010%), Yugoslavian (85.1%, a difference of 0.010%), Immigrants from South Central Asia (85.1%, a difference of 0.010%), and Egyptian (85.1%, a difference of 0.010%).
DemographicsRating | RankIn Labor Force | Age 30-34
Immigrants | Ghana
96.5
/100
|
#104
Exceptional
85.2%
Alsatians
96.3
/100
|
#105
Exceptional
85.2%
Immigrants | Middle Africa
96.3
/100
|
#106
Exceptional
85.2%
Immigrants | Northern Africa
96.3
/100
|
#107
Exceptional
85.2%
Immigrants | Zimbabwe
95.8
/100
|
#108
Exceptional
85.1%
Argentineans
95.8
/100
|
#109
Exceptional
85.1%
Immigrants | South Africa
95.3
/100
|
#110
Exceptional
85.1%
Immigrants | Scotland
94.9
/100
|
#111
Exceptional
85.1%
Immigrants | Hungary
94.8
/100
|
#112
Exceptional
85.1%
Immigrants | Romania
94.7
/100
|
#113
Exceptional
85.1%
Yugoslavians
94.7
/100
|
#114
Exceptional
85.1%
Immigrants | South Central Asia
94.6
/100
|
#115
Exceptional
85.1%
Egyptians
94.5
/100
|
#116
Exceptional
85.1%
Immigrants | Denmark
94.3
/100
|
#117
Exceptional
85.1%
Immigrants | Malaysia
94.2
/100
|
#118
Exceptional
85.1%

Demographics Similar to Palestinians by In Labor Force | Age 30-34

In terms of in labor force | age 30-34, the demographic groups most similar to Palestinians are Uruguayan (84.9%, a difference of 0.010%), Immigrants from Saudi Arabia (84.9%, a difference of 0.010%), Immigrants from Colombia (84.9%, a difference of 0.010%), Immigrants from Pakistan (84.9%, a difference of 0.010%), and Immigrants from Ukraine (84.8%, a difference of 0.020%).
DemographicsRating | RankIn Labor Force | Age 30-34
Sri Lankans
87.8
/100
|
#138
Excellent
85.0%
Bhutanese
87.5
/100
|
#139
Excellent
85.0%
Immigrants | Vietnam
86.5
/100
|
#140
Excellent
85.0%
Chileans
85.3
/100
|
#141
Excellent
84.9%
Immigrants | Indonesia
84.3
/100
|
#142
Excellent
84.9%
Colombians
82.2
/100
|
#143
Excellent
84.9%
Uruguayans
78.5
/100
|
#144
Good
84.9%
Palestinians
77.7
/100
|
#145
Good
84.9%
Immigrants | Saudi Arabia
76.6
/100
|
#146
Good
84.9%
Immigrants | Colombia
76.3
/100
|
#147
Good
84.9%
Immigrants | Pakistan
76.2
/100
|
#148
Good
84.9%
Immigrants | Ukraine
75.1
/100
|
#149
Good
84.8%
Germans
75.1
/100
|
#150
Good
84.8%
Immigrants | Senegal
74.0
/100
|
#151
Good
84.8%
Romanians
73.5
/100
|
#152
Good
84.8%