Immigrants from Saudi Arabia vs Salvadoran In Labor Force | Age > 16
COMPARE
Immigrants from Saudi Arabia
Salvadoran
In Labor Force | Age > 16
In Labor Force | Age > 16 Comparison
Immigrants from Saudi Arabia
Salvadorans
66.3%
IN LABOR FORCE | AGE > 16
99.9/ 100
METRIC RATING
58th/ 347
METRIC RANK
66.8%
IN LABOR FORCE | AGE > 16
100.0/ 100
METRIC RATING
39th/ 347
METRIC RANK
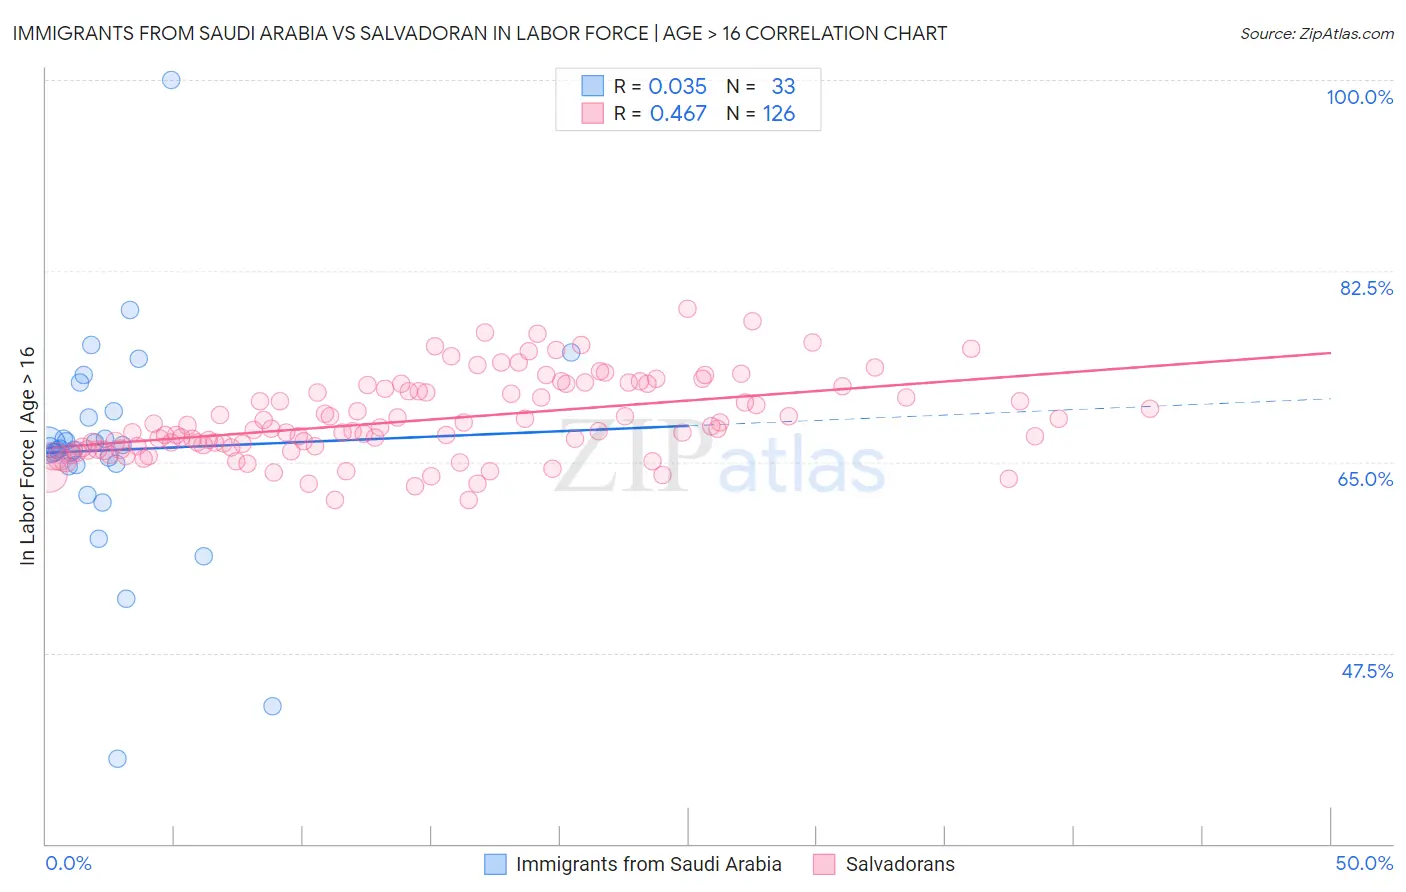
Immigrants from Saudi Arabia vs Salvadoran In Labor Force | Age > 16 Correlation Chart
The statistical analysis conducted on geographies consisting of 164,297,187 people shows no correlation between the proportion of Immigrants from Saudi Arabia and labor force participation rate among population ages 16 and over in the United States with a correlation coefficient (R) of 0.035 and weighted average of 66.3%. Similarly, the statistical analysis conducted on geographies consisting of 399,019,559 people shows a moderate positive correlation between the proportion of Salvadorans and labor force participation rate among population ages 16 and over in the United States with a correlation coefficient (R) of 0.467 and weighted average of 66.8%, a difference of 0.73%.
In Labor Force | Age > 16 Correlation Summary
| Measurement | Immigrants from Saudi Arabia | Salvadoran |
| Minimum | 37.8% | 61.5% |
| Maximum | 100.0% | 79.0% |
| Range | 62.2% | 17.5% |
| Mean | 66.1% | 68.9% |
| Median | 66.2% | 67.9% |
| Interquartile 25% (IQ1) | 64.7% | 66.3% |
| Interquartile 75% (IQ3) | 69.4% | 71.7% |
| Interquartile Range (IQR) | 4.7% | 5.4% |
| Standard Deviation (Sample) | 10.3% | 3.7% |
| Standard Deviation (Population) | 10.2% | 3.7% |
Demographics Similar to Immigrants from Saudi Arabia and Salvadorans by In Labor Force | Age > 16
In terms of in labor force | age > 16, the demographic groups most similar to Immigrants from Saudi Arabia are Bulgarian (66.4%, a difference of 0.10%), Immigrants from Senegal (66.4%, a difference of 0.11%), Immigrants from Venezuela (66.4%, a difference of 0.14%), Immigrants from Bosnia and Herzegovina (66.5%, a difference of 0.19%), and Immigrants from Sri Lanka (66.5%, a difference of 0.22%). Similarly, the demographic groups most similar to Salvadorans are Immigrants from El Salvador (66.8%, a difference of 0.020%), Immigrants from Zimbabwe (66.8%, a difference of 0.020%), Senegalese (66.7%, a difference of 0.11%), Luxembourger (66.7%, a difference of 0.14%), and Immigrants from Nigeria (66.9%, a difference of 0.16%).
| Demographics | Rating | Rank | In Labor Force | Age > 16 |
| Immigrants | Nigeria | 100.0 /100 | #38 | Exceptional 66.9% |
| Salvadorans | 100.0 /100 | #39 | Exceptional 66.8% |
| Immigrants | El Salvador | 100.0 /100 | #40 | Exceptional 66.8% |
| Immigrants | Zimbabwe | 100.0 /100 | #41 | Exceptional 66.8% |
| Senegalese | 100.0 /100 | #42 | Exceptional 66.7% |
| Luxembourgers | 100.0 /100 | #43 | Exceptional 66.7% |
| Immigrants | Pakistan | 100.0 /100 | #44 | Exceptional 66.7% |
| Immigrants | Brazil | 100.0 /100 | #45 | Exceptional 66.7% |
| Brazilians | 100.0 /100 | #46 | Exceptional 66.6% |
| Immigrants | Bulgaria | 100.0 /100 | #47 | Exceptional 66.6% |
| Nigerians | 100.0 /100 | #48 | Exceptional 66.6% |
| Immigrants | Northern Africa | 100.0 /100 | #49 | Exceptional 66.6% |
| Cape Verdeans | 100.0 /100 | #50 | Exceptional 66.6% |
| Immigrants | Kuwait | 100.0 /100 | #51 | Exceptional 66.5% |
| Paraguayans | 99.9 /100 | #52 | Exceptional 66.5% |
| Immigrants | Sri Lanka | 99.9 /100 | #53 | Exceptional 66.5% |
| Immigrants | Bosnia and Herzegovina | 99.9 /100 | #54 | Exceptional 66.5% |
| Immigrants | Venezuela | 99.9 /100 | #55 | Exceptional 66.4% |
| Immigrants | Senegal | 99.9 /100 | #56 | Exceptional 66.4% |
| Bulgarians | 99.9 /100 | #57 | Exceptional 66.4% |
| Immigrants | Saudi Arabia | 99.9 /100 | #58 | Exceptional 66.3% |