Immigrants from Saudi Arabia vs Black/African American In Labor Force | Age > 16
COMPARE
Immigrants from Saudi Arabia
Black/African American
In Labor Force | Age > 16
In Labor Force | Age > 16 Comparison
Immigrants from Saudi Arabia
Blacks/African Americans
66.3%
IN LABOR FORCE | AGE > 16
99.9/ 100
METRIC RATING
58th/ 347
METRIC RANK
63.4%
IN LABOR FORCE | AGE > 16
0.0/ 100
METRIC RATING
306th/ 347
METRIC RANK
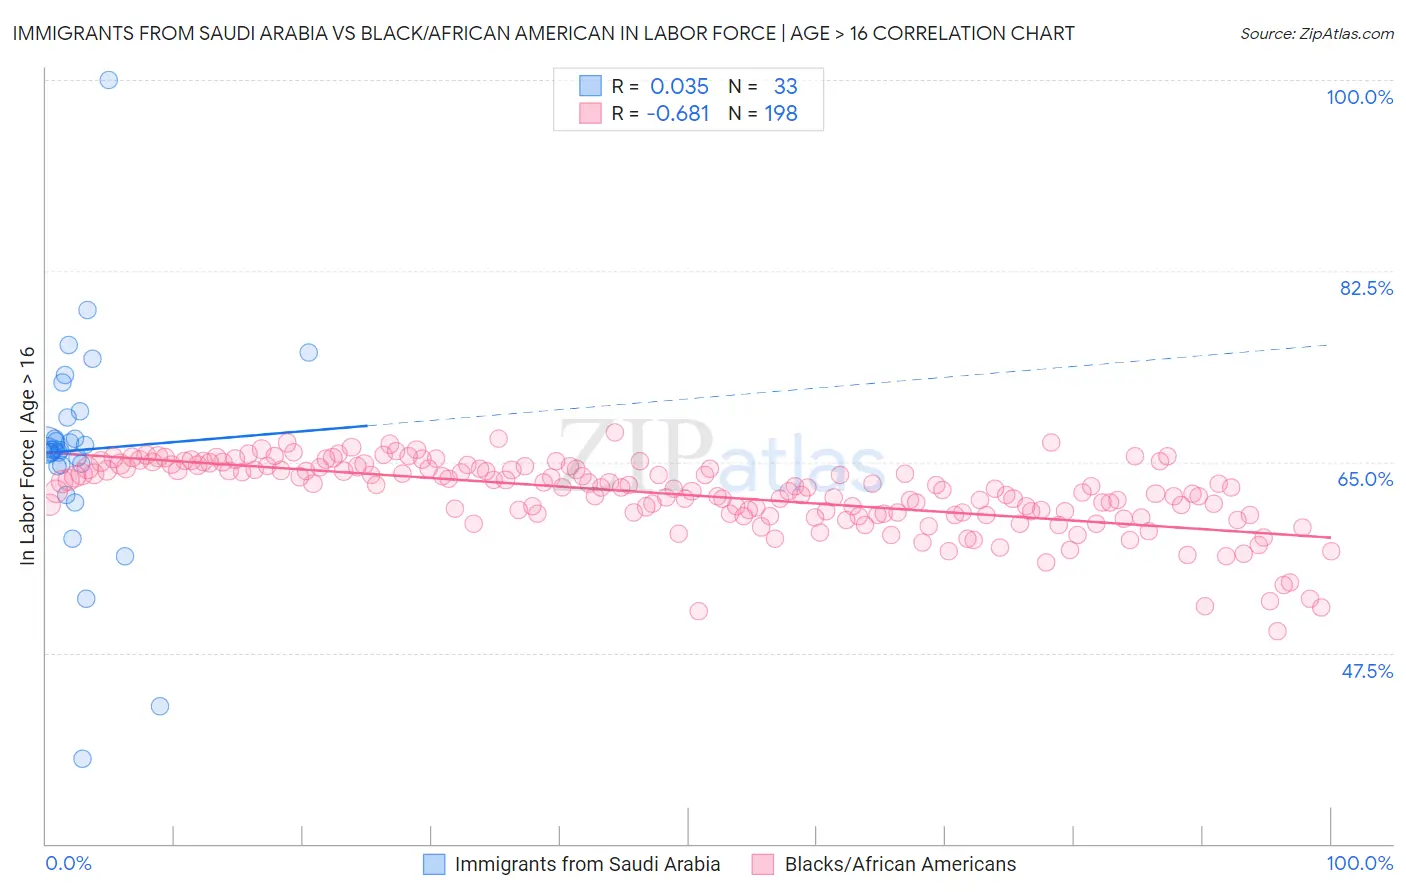
Immigrants from Saudi Arabia vs Black/African American In Labor Force | Age > 16 Correlation Chart
The statistical analysis conducted on geographies consisting of 164,297,187 people shows no correlation between the proportion of Immigrants from Saudi Arabia and labor force participation rate among population ages 16 and over in the United States with a correlation coefficient (R) of 0.035 and weighted average of 66.3%. Similarly, the statistical analysis conducted on geographies consisting of 566,016,902 people shows a significant negative correlation between the proportion of Blacks/African Americans and labor force participation rate among population ages 16 and over in the United States with a correlation coefficient (R) of -0.681 and weighted average of 63.4%, a difference of 4.6%.
In Labor Force | Age > 16 Correlation Summary
| Measurement | Immigrants from Saudi Arabia | Black/African American |
| Minimum | 37.8% | 49.4% |
| Maximum | 100.0% | 67.7% |
| Range | 62.2% | 18.2% |
| Mean | 66.1% | 62.0% |
| Median | 66.2% | 62.6% |
| Interquartile 25% (IQ1) | 64.7% | 60.2% |
| Interquartile 75% (IQ3) | 69.4% | 64.5% |
| Interquartile Range (IQR) | 4.7% | 4.2% |
| Standard Deviation (Sample) | 10.3% | 3.3% |
| Standard Deviation (Population) | 10.2% | 3.3% |
Similar Demographics by In Labor Force | Age > 16
Demographics Similar to Immigrants from Saudi Arabia by In Labor Force | Age > 16
In terms of in labor force | age > 16, the demographic groups most similar to Immigrants from Saudi Arabia are Immigrants from Turkey (66.3%, a difference of 0.020%), Immigrants from Peru (66.3%, a difference of 0.050%), Immigrants from Burma/Myanmar (66.3%, a difference of 0.050%), Indonesian (66.3%, a difference of 0.050%), and Venezuelan (66.3%, a difference of 0.090%).
| Demographics | Rating | Rank | In Labor Force | Age > 16 |
| Immigrants | Kuwait | 100.0 /100 | #51 | Exceptional 66.5% |
| Paraguayans | 99.9 /100 | #52 | Exceptional 66.5% |
| Immigrants | Sri Lanka | 99.9 /100 | #53 | Exceptional 66.5% |
| Immigrants | Bosnia and Herzegovina | 99.9 /100 | #54 | Exceptional 66.5% |
| Immigrants | Venezuela | 99.9 /100 | #55 | Exceptional 66.4% |
| Immigrants | Senegal | 99.9 /100 | #56 | Exceptional 66.4% |
| Bulgarians | 99.9 /100 | #57 | Exceptional 66.4% |
| Immigrants | Saudi Arabia | 99.9 /100 | #58 | Exceptional 66.3% |
| Immigrants | Turkey | 99.9 /100 | #59 | Exceptional 66.3% |
| Immigrants | Peru | 99.8 /100 | #60 | Exceptional 66.3% |
| Immigrants | Burma/Myanmar | 99.8 /100 | #61 | Exceptional 66.3% |
| Indonesians | 99.8 /100 | #62 | Exceptional 66.3% |
| Venezuelans | 99.8 /100 | #63 | Exceptional 66.3% |
| Peruvians | 99.8 /100 | #64 | Exceptional 66.3% |
| Sri Lankans | 99.8 /100 | #65 | Exceptional 66.3% |
Demographics Similar to Blacks/African Americans by In Labor Force | Age > 16
In terms of in labor force | age > 16, the demographic groups most similar to Blacks/African Americans are Central American Indian (63.4%, a difference of 0.030%), Pennsylvania German (63.4%, a difference of 0.080%), Osage (63.5%, a difference of 0.090%), Nonimmigrants (63.5%, a difference of 0.14%), and Cree (63.5%, a difference of 0.19%).
| Demographics | Rating | Rank | In Labor Force | Age > 16 |
| Whites/Caucasians | 0.0 /100 | #299 | Tragic 63.6% |
| Immigrants | Azores | 0.0 /100 | #300 | Tragic 63.6% |
| Spanish Americans | 0.0 /100 | #301 | Tragic 63.6% |
| Delaware | 0.0 /100 | #302 | Tragic 63.6% |
| Cree | 0.0 /100 | #303 | Tragic 63.5% |
| Immigrants | Nonimmigrants | 0.0 /100 | #304 | Tragic 63.5% |
| Osage | 0.0 /100 | #305 | Tragic 63.5% |
| Blacks/African Americans | 0.0 /100 | #306 | Tragic 63.4% |
| Central American Indians | 0.0 /100 | #307 | Tragic 63.4% |
| Pennsylvania Germans | 0.0 /100 | #308 | Tragic 63.4% |
| Scotch-Irish | 0.0 /100 | #309 | Tragic 63.3% |
| Shoshone | 0.0 /100 | #310 | Tragic 63.2% |
| Blackfeet | 0.0 /100 | #311 | Tragic 63.2% |
| Iroquois | 0.0 /100 | #312 | Tragic 63.2% |
| Chippewa | 0.0 /100 | #313 | Tragic 63.1% |