Immigrants from Portugal vs Venezuelan In Labor Force | Age 16-19
COMPARE
Immigrants from Portugal
Venezuelan
In Labor Force | Age 16-19
In Labor Force | Age 16-19 Comparison
Immigrants from Portugal
Venezuelans
39.7%
IN LABOR FORCE | AGE 16-19
99.9/ 100
METRIC RATING
77th/ 347
METRIC RANK
34.0%
IN LABOR FORCE | AGE 16-19
0.3/ 100
METRIC RATING
274th/ 347
METRIC RANK
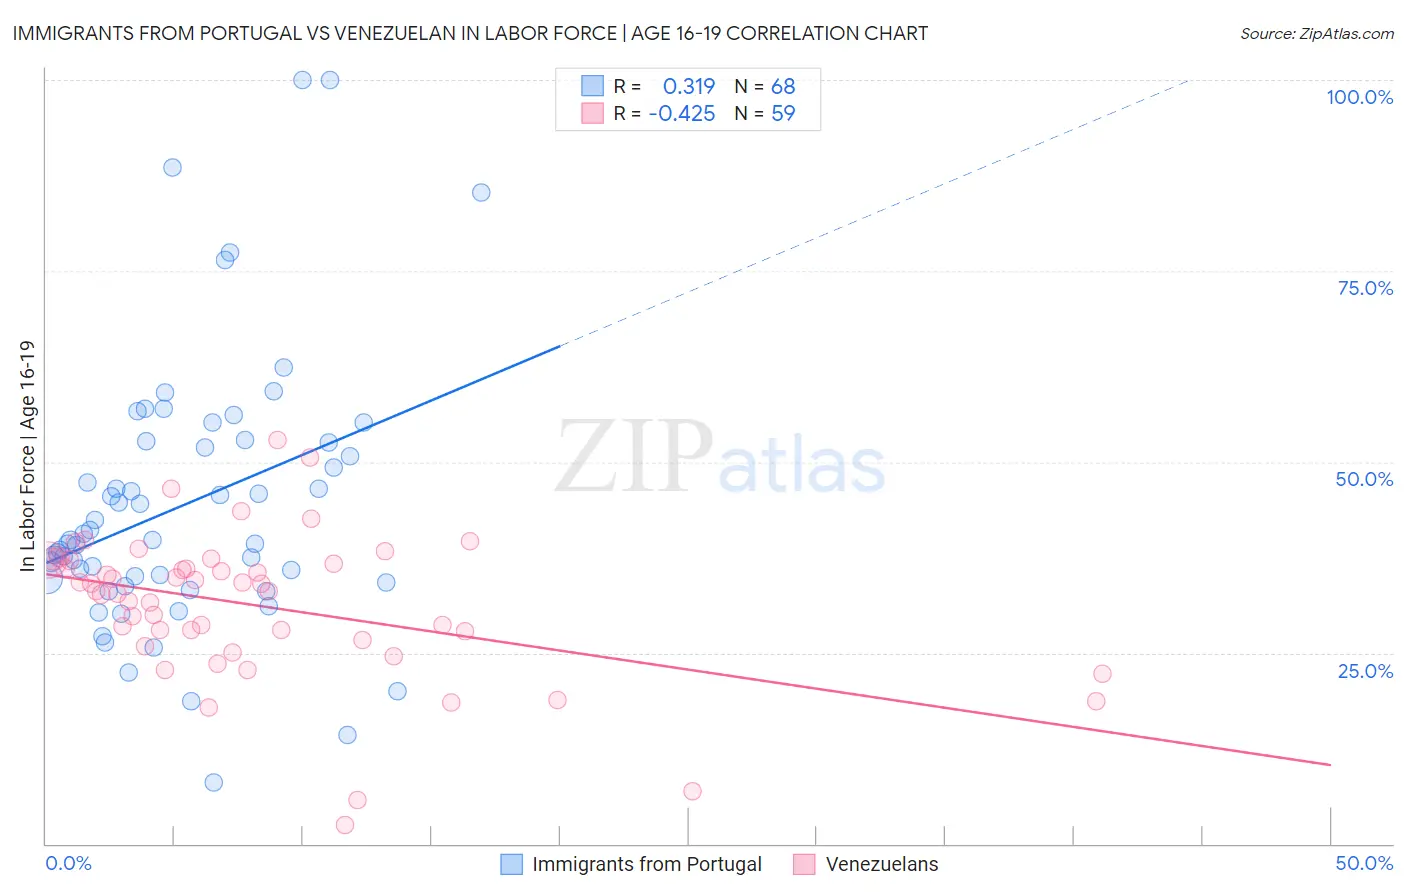
Immigrants from Portugal vs Venezuelan In Labor Force | Age 16-19 Correlation Chart
The statistical analysis conducted on geographies consisting of 174,562,650 people shows a mild positive correlation between the proportion of Immigrants from Portugal and labor force participation rate among population between the ages 16 and 19 in the United States with a correlation coefficient (R) of 0.319 and weighted average of 39.7%. Similarly, the statistical analysis conducted on geographies consisting of 306,036,928 people shows a moderate negative correlation between the proportion of Venezuelans and labor force participation rate among population between the ages 16 and 19 in the United States with a correlation coefficient (R) of -0.425 and weighted average of 34.0%, a difference of 16.8%.
In Labor Force | Age 16-19 Correlation Summary
| Measurement | Immigrants from Portugal | Venezuelan |
| Minimum | 8.0% | 2.4% |
| Maximum | 100.0% | 52.9% |
| Range | 92.0% | 50.5% |
| Mean | 44.4% | 31.2% |
| Median | 39.8% | 33.1% |
| Interquartile 25% (IQ1) | 34.5% | 26.7% |
| Interquartile 75% (IQ3) | 52.6% | 37.1% |
| Interquartile Range (IQR) | 18.1% | 10.4% |
| Standard Deviation (Sample) | 17.8% | 9.6% |
| Standard Deviation (Population) | 17.6% | 9.5% |
Similar Demographics by In Labor Force | Age 16-19
Demographics Similar to Immigrants from Portugal by In Labor Force | Age 16-19
In terms of in labor force | age 16-19, the demographic groups most similar to Immigrants from Portugal are Malaysian (39.7%, a difference of 0.13%), Austrian (39.5%, a difference of 0.39%), French American Indian (39.8%, a difference of 0.40%), Hungarian (39.8%, a difference of 0.42%), and Marshallese (39.5%, a difference of 0.52%).
| Demographics | Rating | Rank | In Labor Force | Age 16-19 |
| Portuguese | 99.9 /100 | #70 | Exceptional 40.0% |
| Serbians | 99.9 /100 | #71 | Exceptional 39.9% |
| Iroquois | 99.9 /100 | #72 | Exceptional 39.9% |
| Immigrants | Middle Africa | 99.9 /100 | #73 | Exceptional 39.9% |
| Hungarians | 99.9 /100 | #74 | Exceptional 39.8% |
| French American Indians | 99.9 /100 | #75 | Exceptional 39.8% |
| Malaysians | 99.9 /100 | #76 | Exceptional 39.7% |
| Immigrants | Portugal | 99.9 /100 | #77 | Exceptional 39.7% |
| Austrians | 99.8 /100 | #78 | Exceptional 39.5% |
| Marshallese | 99.8 /100 | #79 | Exceptional 39.5% |
| Immigrants | Iraq | 99.8 /100 | #80 | Exceptional 39.4% |
| Shoshone | 99.7 /100 | #81 | Exceptional 39.3% |
| Basques | 99.7 /100 | #82 | Exceptional 39.3% |
| Spanish | 99.7 /100 | #83 | Exceptional 39.3% |
| Immigrants | Uganda | 99.7 /100 | #84 | Exceptional 39.2% |
Demographics Similar to Venezuelans by In Labor Force | Age 16-19
In terms of in labor force | age 16-19, the demographic groups most similar to Venezuelans are Immigrants from Panama (34.0%, a difference of 0.090%), Immigrants from Fiji (33.9%, a difference of 0.090%), Immigrants from Latin America (33.9%, a difference of 0.20%), Asian (34.1%, a difference of 0.31%), and Menominee (33.9%, a difference of 0.31%).
| Demographics | Rating | Rank | In Labor Force | Age 16-19 |
| Immigrants | Peru | 0.5 /100 | #267 | Tragic 34.2% |
| Immigrants | Asia | 0.5 /100 | #268 | Tragic 34.1% |
| Pima | 0.5 /100 | #269 | Tragic 34.1% |
| Immigrants | Russia | 0.4 /100 | #270 | Tragic 34.1% |
| Central American Indians | 0.4 /100 | #271 | Tragic 34.1% |
| Asians | 0.4 /100 | #272 | Tragic 34.1% |
| Immigrants | Panama | 0.4 /100 | #273 | Tragic 34.0% |
| Venezuelans | 0.3 /100 | #274 | Tragic 34.0% |
| Immigrants | Fiji | 0.3 /100 | #275 | Tragic 33.9% |
| Immigrants | Latin America | 0.3 /100 | #276 | Tragic 33.9% |
| Menominee | 0.3 /100 | #277 | Tragic 33.9% |
| Colombians | 0.3 /100 | #278 | Tragic 33.8% |
| Paraguayans | 0.3 /100 | #279 | Tragic 33.8% |
| Taiwanese | 0.3 /100 | #280 | Tragic 33.8% |
| Cypriots | 0.3 /100 | #281 | Tragic 33.8% |