Immigrants from Portugal vs Immigrants from Belize In Labor Force | Age 16-19
COMPARE
Immigrants from Portugal
Immigrants from Belize
In Labor Force | Age 16-19
In Labor Force | Age 16-19 Comparison
Immigrants from Portugal
Immigrants from Belize
39.7%
IN LABOR FORCE | AGE 16-19
99.9/ 100
METRIC RATING
77th/ 347
METRIC RANK
31.8%
IN LABOR FORCE | AGE 16-19
0.0/ 100
METRIC RATING
312th/ 347
METRIC RANK
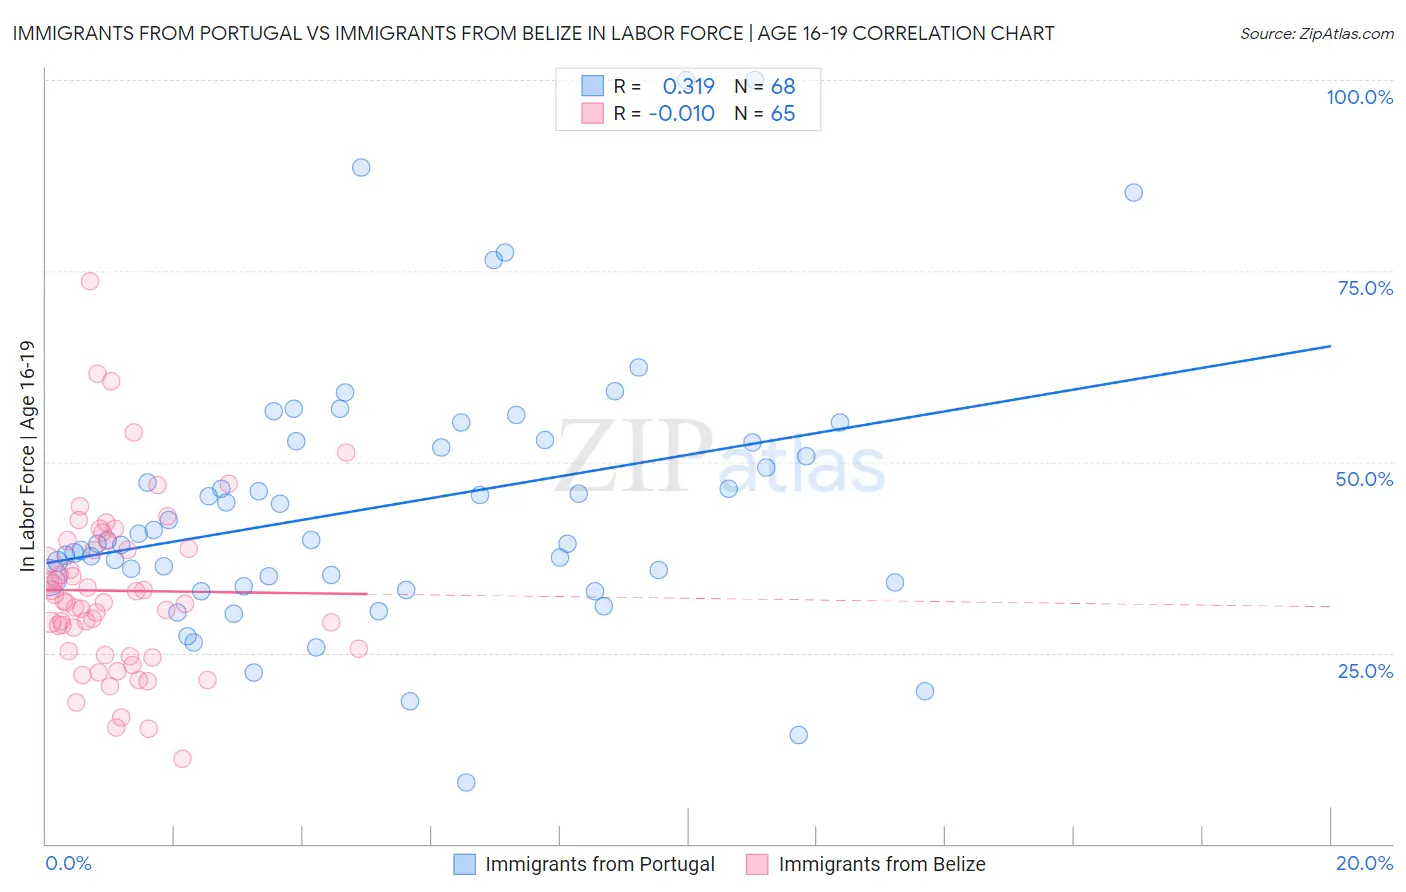
Immigrants from Portugal vs Immigrants from Belize In Labor Force | Age 16-19 Correlation Chart
The statistical analysis conducted on geographies consisting of 174,562,650 people shows a mild positive correlation between the proportion of Immigrants from Portugal and labor force participation rate among population between the ages 16 and 19 in the United States with a correlation coefficient (R) of 0.319 and weighted average of 39.7%. Similarly, the statistical analysis conducted on geographies consisting of 130,258,278 people shows no correlation between the proportion of Immigrants from Belize and labor force participation rate among population between the ages 16 and 19 in the United States with a correlation coefficient (R) of -0.010 and weighted average of 31.8%, a difference of 24.7%.
In Labor Force | Age 16-19 Correlation Summary
| Measurement | Immigrants from Portugal | Immigrants from Belize |
| Minimum | 8.0% | 11.1% |
| Maximum | 100.0% | 73.6% |
| Range | 92.0% | 62.5% |
| Mean | 44.4% | 33.1% |
| Median | 39.8% | 31.6% |
| Interquartile 25% (IQ1) | 34.5% | 25.0% |
| Interquartile 75% (IQ3) | 52.6% | 39.1% |
| Interquartile Range (IQR) | 18.1% | 14.1% |
| Standard Deviation (Sample) | 17.8% | 11.4% |
| Standard Deviation (Population) | 17.6% | 11.3% |
Similar Demographics by In Labor Force | Age 16-19
Demographics Similar to Immigrants from Portugal by In Labor Force | Age 16-19
In terms of in labor force | age 16-19, the demographic groups most similar to Immigrants from Portugal are Malaysian (39.7%, a difference of 0.13%), Austrian (39.5%, a difference of 0.39%), French American Indian (39.8%, a difference of 0.40%), Hungarian (39.8%, a difference of 0.42%), and Marshallese (39.5%, a difference of 0.52%).
| Demographics | Rating | Rank | In Labor Force | Age 16-19 |
| Portuguese | 99.9 /100 | #70 | Exceptional 40.0% |
| Serbians | 99.9 /100 | #71 | Exceptional 39.9% |
| Iroquois | 99.9 /100 | #72 | Exceptional 39.9% |
| Immigrants | Middle Africa | 99.9 /100 | #73 | Exceptional 39.9% |
| Hungarians | 99.9 /100 | #74 | Exceptional 39.8% |
| French American Indians | 99.9 /100 | #75 | Exceptional 39.8% |
| Malaysians | 99.9 /100 | #76 | Exceptional 39.7% |
| Immigrants | Portugal | 99.9 /100 | #77 | Exceptional 39.7% |
| Austrians | 99.8 /100 | #78 | Exceptional 39.5% |
| Marshallese | 99.8 /100 | #79 | Exceptional 39.5% |
| Immigrants | Iraq | 99.8 /100 | #80 | Exceptional 39.4% |
| Shoshone | 99.7 /100 | #81 | Exceptional 39.3% |
| Basques | 99.7 /100 | #82 | Exceptional 39.3% |
| Spanish | 99.7 /100 | #83 | Exceptional 39.3% |
| Immigrants | Uganda | 99.7 /100 | #84 | Exceptional 39.2% |
Demographics Similar to Immigrants from Belize by In Labor Force | Age 16-19
In terms of in labor force | age 16-19, the demographic groups most similar to Immigrants from Belize are Hopi (31.8%, a difference of 0.010%), Indian (Asian) (31.9%, a difference of 0.14%), Cuban (31.8%, a difference of 0.16%), Immigrants from West Indies (31.7%, a difference of 0.34%), and Filipino (31.7%, a difference of 0.43%).
| Demographics | Rating | Rank | In Labor Force | Age 16-19 |
| Nicaraguans | 0.0 /100 | #305 | Tragic 32.4% |
| Spanish American Indians | 0.0 /100 | #306 | Tragic 32.4% |
| Immigrants | Jamaica | 0.0 /100 | #307 | Tragic 32.2% |
| Navajo | 0.0 /100 | #308 | Tragic 32.1% |
| Immigrants | Eastern Asia | 0.0 /100 | #309 | Tragic 32.0% |
| Immigrants | Iran | 0.0 /100 | #310 | Tragic 32.0% |
| Indians (Asian) | 0.0 /100 | #311 | Tragic 31.9% |
| Immigrants | Belize | 0.0 /100 | #312 | Tragic 31.8% |
| Hopi | 0.0 /100 | #313 | Tragic 31.8% |
| Cubans | 0.0 /100 | #314 | Tragic 31.8% |
| Immigrants | West Indies | 0.0 /100 | #315 | Tragic 31.7% |
| Filipinos | 0.0 /100 | #316 | Tragic 31.7% |
| Immigrants | Nicaragua | 0.0 /100 | #317 | Tragic 31.6% |
| Immigrants | Yemen | 0.0 /100 | #318 | Tragic 31.5% |
| Soviet Union | 0.0 /100 | #319 | Tragic 31.4% |