Immigrants from Philippines vs Immigrants from Chile In Labor Force | Age 30-34

COMPARE

Immigrants from Philippines
Race
Ancestry
AfghanAfricanAlaska NativeAlaskan AthabascanAlbanianAleutAlsatianAmericanApacheArabArapahoArgentineanArmenianAssyrian/Chaldean/SyriacAustralianAustrianBahamianBangladeshiBarbadianBasqueBelgianBelizeanBermudanBhutaneseBlackfeetBolivianBrazilianBritishBritish West IndianBulgarianBurmeseCajunCambodianCanadianCape VerdeanCarpatho RusynCelticCentral AmericanCentral American IndianCherokeeCheyenneChickasawChileanChineseChippewaChoctawColombianColvilleComancheCosta RicanCreeCreekCroatianCrowCubanCypriotCzechCzechoslovakianDanishDelawareDominicanDutchDutch West IndianEastern EuropeanEcuadorianEgyptianEnglishEstonianEthiopianEuropeanFijianFilipinoFinnishFrenchFrench American IndianFrench CanadianGermanGerman RussianGhanaianGreekGuamanian/ChamorroGuatemalanGuyaneseHaitianHmongHonduranHopiHoumaHungarianIcelanderIndian (Asian)IndonesianInupiatIranianIraqiIrishIroquoisIsraeliItalianJamaicanJapaneseJordanianKenyanKiowaKoreanLaotianLatvianLebaneseLiberianLithuanianLumbeeLuxembourgerMacedonianMalaysianMalteseMarshalleseMenomineeMexicanMexican American IndianMongolianMoroccanNative HawaiianNavajoNepaleseNew ZealanderNicaraguanNigerianNorthern EuropeanNorwegianOkinawanOsageOttawaPaiutePakistaniPalestinianPanamanianParaguayanPennsylvania GermanPeruvianPimaPolishPortuguesePotawatomiPuebloPuerto RicanPuget Sound SalishRomanianRussianSalvadoranSamoanScandinavianScotch-IrishScottishSeminoleSenegaleseSerbianShoshoneSierra LeoneanSiouxSlavicSlovakSloveneSomaliSouth AfricanSouth AmericanSouth American IndianSoviet UnionSpaniardSpanishSpanish AmericanSpanish American IndianSri LankanSubsaharan AfricanSudaneseSwedishSwissSyrianTaiwaneseThaiTlingit-HaidaTohono O'OdhamTonganTrinidadian and TobagonianTsimshianTurkishU.S. Virgin IslanderUgandanUkrainianUruguayanUteVenezuelanVietnameseWelshWest IndianYakamaYaquiYugoslavianYumanYup'ikZimbabwean
Immigration
NonimmigrantsImmigrantsAfghanistanAfricaAlbaniaArgentinaArmeniaAsiaAustraliaAustriaBahamasBangladeshBarbadosBelarusBelgiumBelizeBoliviaBosnia and HerzegovinaBrazilBulgariaBurma/MyanmarCabo VerdeCambodiaCameroonCanadaCaribbeanCentral AmericaChinaColombiaCongoCosta RicaCroatiaCubaCzechoslovakiaDenmarkDominicaDominican RepublicEastern AfricaEastern AsiaEastern EuropeEcuadorEgyptEl SalvadorEnglandEritreaEthiopiaEuropeFijiFranceGermanyGhanaGreeceGrenadaGuatemalaGuyanaHaitiHondurasHong KongHungaryIndiaIndonesiaIranIraqIrelandIsraelItalyJamaicaJapanJordanKazakhstanKenyaKoreaKuwaitLaosLatin AmericaLatviaLebanonLiberiaLithuaniaMalaysiaMexicoMicronesiaMiddle AfricaMoldovaMoroccoNepalNetherlandsNicaraguaNigeriaNorth AmericaNorth MacedoniaNorthern AfricaNorthern EuropeNorwayOceaniaPakistanPanamaPeruPhilippinesPolandPortugalRomaniaRussiaSaudi ArabiaScotlandSenegalSerbiaSierra LeoneSingaporeSomaliaSouth AfricaSouth AmericaSouth Central AsiaSouth Eastern AsiaSouthern EuropeSpainSri LankaSt. Vincent and the GrenadinesSudanSwedenSwitzerlandSyriaTaiwanThailandTrinidad and TobagoTurkeyUgandaUkraineUruguayUzbekistanVenezuelaVietnamWest IndiesWestern AfricaWestern AsiaWestern EuropeYemenZaireZimbabweAzores
Immigrants from Chile
Race
Ancestry
AfghanAfricanAlaska NativeAlaskan AthabascanAlbanianAleutAlsatianAmericanApacheArabArapahoArgentineanArmenianAssyrian/Chaldean/SyriacAustralianAustrianBahamianBangladeshiBarbadianBasqueBelgianBelizeanBermudanBhutaneseBlackfeetBolivianBrazilianBritishBritish West IndianBulgarianBurmeseCajunCambodianCanadianCape VerdeanCarpatho RusynCelticCentral AmericanCentral American IndianCherokeeCheyenneChickasawChileanChineseChippewaChoctawColombianColvilleComancheCosta RicanCreeCreekCroatianCrowCubanCypriotCzechCzechoslovakianDanishDelawareDominicanDutchDutch West IndianEastern EuropeanEcuadorianEgyptianEnglishEstonianEthiopianEuropeanFijianFilipinoFinnishFrenchFrench American IndianFrench CanadianGermanGerman RussianGhanaianGreekGuamanian/ChamorroGuatemalanGuyaneseHaitianHmongHonduranHopiHoumaHungarianIcelanderIndian (Asian)IndonesianInupiatIranianIraqiIrishIroquoisIsraeliItalianJamaicanJapaneseJordanianKenyanKiowaKoreanLaotianLatvianLebaneseLiberianLithuanianLumbeeLuxembourgerMacedonianMalaysianMalteseMarshalleseMenomineeMexicanMexican American IndianMongolianMoroccanNative HawaiianNavajoNepaleseNew ZealanderNicaraguanNigerianNorthern EuropeanNorwegianOkinawanOsageOttawaPaiutePakistaniPalestinianPanamanianParaguayanPennsylvania GermanPeruvianPimaPolishPortuguesePotawatomiPuebloPuerto RicanPuget Sound SalishRomanianRussianSalvadoranSamoanScandinavianScotch-IrishScottishSeminoleSenegaleseSerbianShoshoneSierra LeoneanSiouxSlavicSlovakSloveneSomaliSouth AfricanSouth AmericanSouth American IndianSoviet UnionSpaniardSpanishSpanish AmericanSpanish American IndianSri LankanSubsaharan AfricanSudaneseSwedishSwissSyrianTaiwaneseThaiTlingit-HaidaTohono O'OdhamTonganTrinidadian and TobagonianTsimshianTurkishU.S. Virgin IslanderUgandanUkrainianUruguayanUteVenezuelanVietnameseWelshWest IndianYakamaYaquiYugoslavianYumanYup'ikZimbabwean
Immigration
NonimmigrantsImmigrantsAfghanistanAfricaAlbaniaArgentinaArmeniaAsiaAustraliaAustriaBahamasBangladeshBarbadosBelarusBelgiumBelizeBoliviaBosnia and HerzegovinaBrazilBulgariaBurma/MyanmarCabo VerdeCambodiaCameroonCanadaCaribbeanCentral AmericaChileChinaColombiaCongoCosta RicaCroatiaCubaCzechoslovakiaDenmarkDominicaDominican RepublicEastern AfricaEastern AsiaEastern EuropeEcuadorEgyptEl SalvadorEnglandEritreaEthiopiaEuropeFijiFranceGermanyGhanaGreeceGrenadaGuatemalaGuyanaHaitiHondurasHong KongHungaryIndiaIndonesiaIranIraqIrelandIsraelItalyJamaicaJapanJordanKazakhstanKenyaKoreaKuwaitLaosLatin AmericaLatviaLebanonLiberiaLithuaniaMalaysiaMexicoMicronesiaMiddle AfricaMoldovaMoroccoNepalNetherlandsNicaraguaNigeriaNorth AmericaNorth MacedoniaNorthern AfricaNorthern EuropeNorwayOceaniaPakistanPanamaPeruPolandPortugalRomaniaRussiaSaudi ArabiaScotlandSenegalSerbiaSierra LeoneSingaporeSomaliaSouth AfricaSouth AmericaSouth Central AsiaSouth Eastern AsiaSouthern EuropeSpainSri LankaSt. Vincent and the GrenadinesSudanSwedenSwitzerlandSyriaTaiwanThailandTrinidad and TobagoTurkeyUgandaUkraineUruguayUzbekistanVenezuelaVietnamWest IndiesWestern AfricaWestern AsiaWestern EuropeYemenZaireZimbabweAzores
In Labor Force | Age 30-34
Income
Poverty
Unemployment
Labor Participation
Family Structure
Vehicle Availability
Education Level
Disability

In Labor Force | Age 30-34 Comparison

Immigrants from Philippines

Immigrants from Chile

Fair
Excellent
84.6%
IN LABOR FORCE | AGE 30-34
31.5/ 100
METRIC RATING
185th/ 347
METRIC RANK
85.0%
IN LABOR FORCE | AGE 30-34
89.2/ 100
METRIC RATING
134th/ 347
METRIC RANK

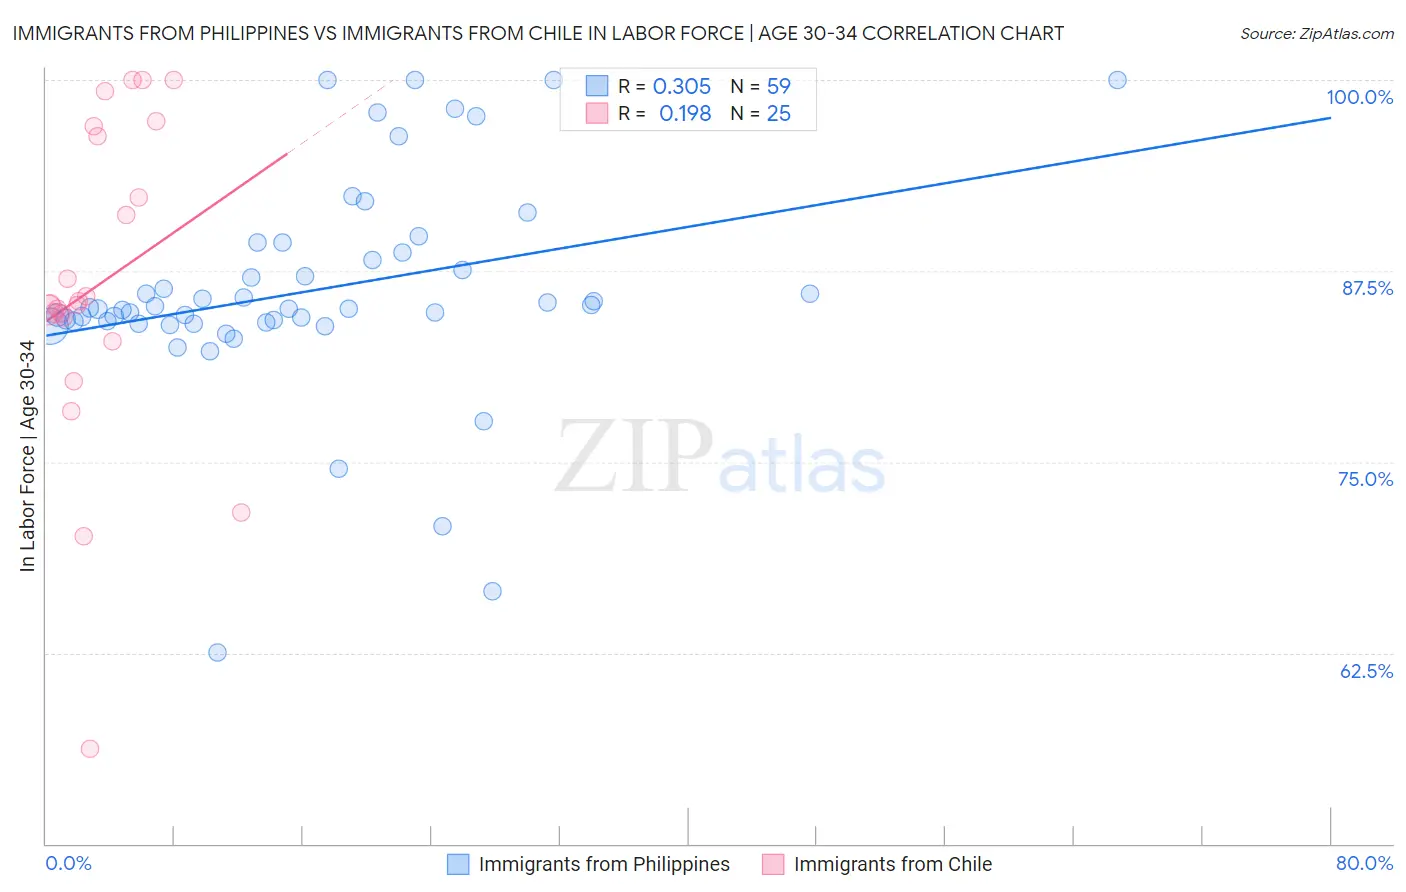
Immigrants from Philippines vs Immigrants from Chile In Labor Force | Age 30-34 Correlation Chart

The statistical analysis conducted on geographies consisting of 471,048,330 people shows a mild positive correlation between the proportion of Immigrants from Philippines and labor force participation rate among population between the ages 30 and 34 in the United States with a correlation coefficient (R) of 0.305 and weighted average of 84.6%. Similarly, the statistical analysis conducted on geographies consisting of 218,612,214 people shows a poor positive correlation between the proportion of Immigrants from Chile and labor force participation rate among population between the ages 30 and 34 in the United States with a correlation coefficient (R) of 0.198 and weighted average of 85.0%, a difference of 0.51%.
Immigrants from Philippines vs Immigrants from Chile In Labor Force | Age 30-34

In Labor Force | Age 30-34 Correlation Summary

MeasurementImmigrants from PhilippinesImmigrants from Chile
Minimum62.5%56.2%
Maximum100.0%100.0%
Range37.5%43.8%
Mean86.2%86.6%
Median85.0%85.3%
Interquartile 25% (IQ1)84.2%83.7%
Interquartile 75% (IQ3)88.7%96.6%
Interquartile Range (IQR)4.5%13.0%
Standard Deviation (Sample)7.1%10.5%
Standard Deviation (Population)7.1%10.3%

Similar Demographics by In Labor Force | Age 30-34

Demographics Similar to Immigrants from Philippines by In Labor Force | Age 30-34

In terms of in labor force | age 30-34, the demographic groups most similar to Immigrants from Philippines are Immigrants from North America (84.6%, a difference of 0.010%), Immigrants from Congo (84.6%, a difference of 0.010%), Costa Rican (84.6%, a difference of 0.020%), Taiwanese (84.6%, a difference of 0.020%), and Nigerian (84.5%, a difference of 0.020%).
DemographicsRating | RankIn Labor Force | Age 30-34
Okinawans
44.1
/100
|
#178
Average
84.6%
Immigrants | Nigeria
42.5
/100
|
#179
Average
84.6%
Immigrants | Netherlands
42.1
/100
|
#180
Average
84.6%
Moroccans
40.3
/100
|
#181
Average
84.6%
Barbadians
36.7
/100
|
#182
Fair
84.6%
Immigrants | Canada
35.0
/100
|
#183
Fair
84.6%
Immigrants | North America
33.3
/100
|
#184
Fair
84.6%
Immigrants | Philippines
31.5
/100
|
#185
Fair
84.6%
Immigrants | Congo
29.7
/100
|
#186
Fair
84.6%
Costa Ricans
29.6
/100
|
#187
Fair
84.6%
Taiwanese
29.4
/100
|
#188
Fair
84.6%
Nigerians
28.9
/100
|
#189
Fair
84.5%
Immigrants | Zaire
25.8
/100
|
#190
Fair
84.5%
Hungarians
24.8
/100
|
#191
Fair
84.5%
Scandinavians
24.7
/100
|
#192
Fair
84.5%

Demographics Similar to Immigrants from Chile by In Labor Force | Age 30-34

In terms of in labor force | age 30-34, the demographic groups most similar to Immigrants from Chile are Immigrants from Asia (85.0%, a difference of 0.0%), Chinese (85.0%, a difference of 0.010%), Immigrants from Israel (85.0%, a difference of 0.010%), New Zealander (85.0%, a difference of 0.010%), and Jordanian (85.0%, a difference of 0.010%).
DemographicsRating | RankIn Labor Force | Age 30-34
Slavs
90.7
/100
|
#127
Exceptional
85.0%
Immigrants | Argentina
90.6
/100
|
#128
Exceptional
85.0%
Immigrants | Western Africa
90.2
/100
|
#129
Exceptional
85.0%
Immigrants | Spain
90.0
/100
|
#130
Exceptional
85.0%
Chinese
89.6
/100
|
#131
Excellent
85.0%
Immigrants | Israel
89.5
/100
|
#132
Excellent
85.0%
New Zealanders
89.5
/100
|
#133
Excellent
85.0%
Immigrants | Chile
89.2
/100
|
#134
Excellent
85.0%
Immigrants | Asia
88.9
/100
|
#135
Excellent
85.0%
Jordanians
88.6
/100
|
#136
Excellent
85.0%
South Africans
88.0
/100
|
#137
Excellent
85.0%
Sri Lankans
87.8
/100
|
#138
Excellent
85.0%
Bhutanese
87.5
/100
|
#139
Excellent
85.0%
Immigrants | Vietnam
86.5
/100
|
#140
Excellent
85.0%
Chileans
85.3
/100
|
#141
Excellent
84.9%