Immigrants from Middle Africa vs Lumbee In Labor Force | Age 30-34
COMPARE
Immigrants from Middle Africa
Lumbee
In Labor Force | Age 30-34
In Labor Force | Age 30-34 Comparison
Immigrants from Middle Africa
Lumbee
85.2%
IN LABOR FORCE | AGE 30-34
96.3/ 100
METRIC RATING
106th/ 347
METRIC RANK
77.3%
IN LABOR FORCE | AGE 30-34
0.0/ 100
METRIC RATING
343rd/ 347
METRIC RANK
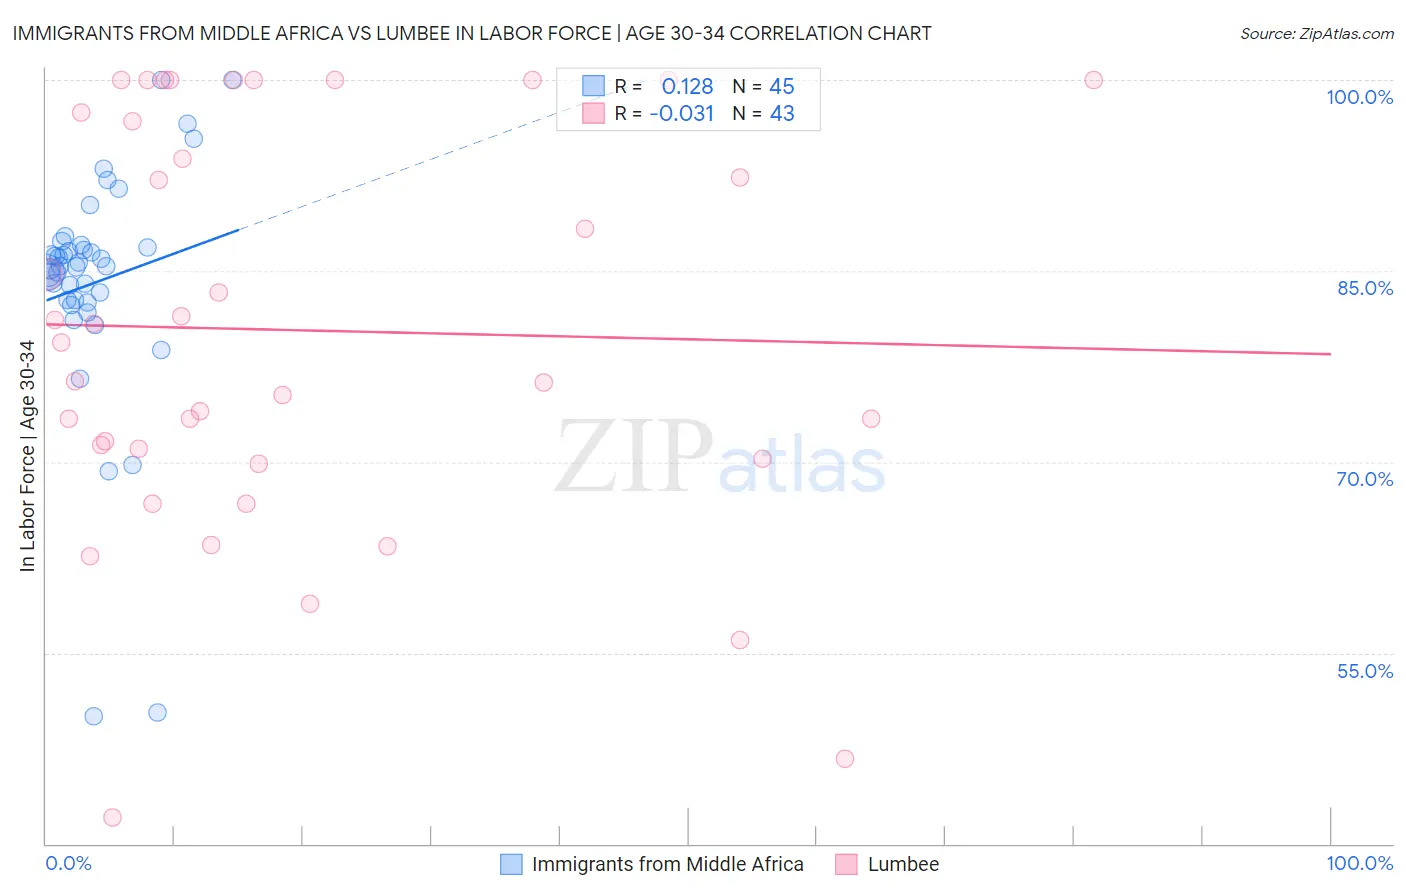
Immigrants from Middle Africa vs Lumbee In Labor Force | Age 30-34 Correlation Chart
The statistical analysis conducted on geographies consisting of 202,689,912 people shows a poor positive correlation between the proportion of Immigrants from Middle Africa and labor force participation rate among population between the ages 30 and 34 in the United States with a correlation coefficient (R) of 0.128 and weighted average of 85.2%. Similarly, the statistical analysis conducted on geographies consisting of 92,256,461 people shows no correlation between the proportion of Lumbee and labor force participation rate among population between the ages 30 and 34 in the United States with a correlation coefficient (R) of -0.031 and weighted average of 77.3%, a difference of 10.2%.
In Labor Force | Age 30-34 Correlation Summary
| Measurement | Immigrants from Middle Africa | Lumbee |
| Minimum | 50.0% | 42.1% |
| Maximum | 100.0% | 100.0% |
| Range | 50.0% | 57.9% |
| Mean | 84.1% | 80.3% |
| Median | 85.3% | 79.4% |
| Interquartile 25% (IQ1) | 82.6% | 70.2% |
| Interquartile 75% (IQ3) | 86.9% | 97.5% |
| Interquartile Range (IQR) | 4.3% | 27.2% |
| Standard Deviation (Sample) | 9.5% | 15.9% |
| Standard Deviation (Population) | 9.4% | 15.7% |
Similar Demographics by In Labor Force | Age 30-34
Demographics Similar to Immigrants from Middle Africa by In Labor Force | Age 30-34
In terms of in labor force | age 30-34, the demographic groups most similar to Immigrants from Middle Africa are Alsatian (85.2%, a difference of 0.0%), Immigrants from Northern Africa (85.2%, a difference of 0.0%), Ukrainian (85.2%, a difference of 0.010%), Immigrants from Ghana (85.2%, a difference of 0.010%), and Immigrants from Austria (85.2%, a difference of 0.020%).
| Demographics | Rating | Rank | In Labor Force | Age 30-34 |
| Belgians | 97.2 /100 | #99 | Exceptional 85.2% |
| Sudanese | 97.1 /100 | #100 | Exceptional 85.2% |
| Immigrants | Belarus | 96.9 /100 | #101 | Exceptional 85.2% |
| Immigrants | Austria | 96.8 /100 | #102 | Exceptional 85.2% |
| Ukrainians | 96.6 /100 | #103 | Exceptional 85.2% |
| Immigrants | Ghana | 96.5 /100 | #104 | Exceptional 85.2% |
| Alsatians | 96.3 /100 | #105 | Exceptional 85.2% |
| Immigrants | Middle Africa | 96.3 /100 | #106 | Exceptional 85.2% |
| Immigrants | Northern Africa | 96.3 /100 | #107 | Exceptional 85.2% |
| Immigrants | Zimbabwe | 95.8 /100 | #108 | Exceptional 85.1% |
| Argentineans | 95.8 /100 | #109 | Exceptional 85.1% |
| Immigrants | South Africa | 95.3 /100 | #110 | Exceptional 85.1% |
| Immigrants | Scotland | 94.9 /100 | #111 | Exceptional 85.1% |
| Immigrants | Hungary | 94.8 /100 | #112 | Exceptional 85.1% |
| Immigrants | Romania | 94.7 /100 | #113 | Exceptional 85.1% |
Demographics Similar to Lumbee by In Labor Force | Age 30-34
In terms of in labor force | age 30-34, the demographic groups most similar to Lumbee are Yuman (77.1%, a difference of 0.23%), Tohono O'odham (77.7%, a difference of 0.60%), Yup'ik (76.4%, a difference of 1.1%), Immigrants from Yemen (78.2%, a difference of 1.2%), and Crow (75.9%, a difference of 1.8%).
| Demographics | Rating | Rank | In Labor Force | Age 30-34 |
| Inupiat | 0.0 /100 | #333 | Tragic 79.7% |
| Hopi | 0.0 /100 | #334 | Tragic 79.3% |
| Marshallese | 0.0 /100 | #335 | Tragic 79.2% |
| Natives/Alaskans | 0.0 /100 | #336 | Tragic 79.2% |
| Yakama | 0.0 /100 | #337 | Tragic 79.1% |
| Pima | 0.0 /100 | #338 | Tragic 79.0% |
| Apache | 0.0 /100 | #339 | Tragic 79.0% |
| Ute | 0.0 /100 | #340 | Tragic 78.9% |
| Immigrants | Yemen | 0.0 /100 | #341 | Tragic 78.2% |
| Tohono O'odham | 0.0 /100 | #342 | Tragic 77.7% |
| Lumbee | 0.0 /100 | #343 | Tragic 77.3% |
| Yuman | 0.0 /100 | #344 | Tragic 77.1% |
| Yup'ik | 0.0 /100 | #345 | Tragic 76.4% |
| Crow | 0.0 /100 | #346 | Tragic 75.9% |
| Navajo | 0.0 /100 | #347 | Tragic 73.8% |