Immigrants from Mexico vs Chippewa In Labor Force | Age 35-44
COMPARE
Immigrants from Mexico
Chippewa
In Labor Force | Age 35-44
In Labor Force | Age 35-44 Comparison
Immigrants from Mexico
Chippewa
81.5%
IN LABOR FORCE | AGE 35-44
0.0/ 100
METRIC RATING
315th/ 347
METRIC RANK
82.9%
IN LABOR FORCE | AGE 35-44
0.0/ 100
METRIC RATING
289th/ 347
METRIC RANK
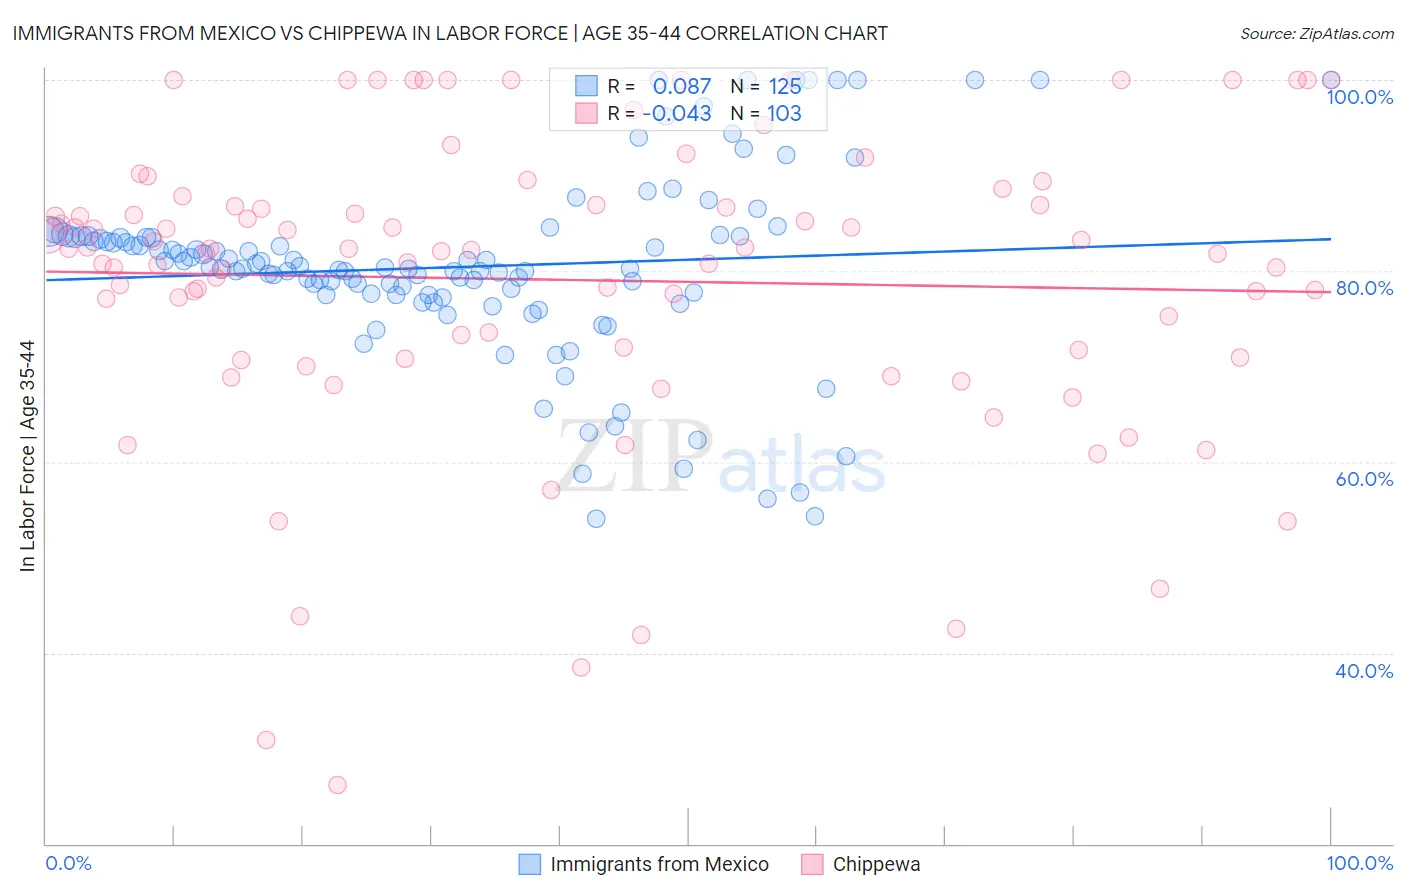
Immigrants from Mexico vs Chippewa In Labor Force | Age 35-44 Correlation Chart
The statistical analysis conducted on geographies consisting of 513,440,276 people shows a slight positive correlation between the proportion of Immigrants from Mexico and labor force participation rate among population between the ages 35 and 44 in the United States with a correlation coefficient (R) of 0.087 and weighted average of 81.5%. Similarly, the statistical analysis conducted on geographies consisting of 215,016,348 people shows no correlation between the proportion of Chippewa and labor force participation rate among population between the ages 35 and 44 in the United States with a correlation coefficient (R) of -0.043 and weighted average of 82.9%, a difference of 1.7%.
In Labor Force | Age 35-44 Correlation Summary
| Measurement | Immigrants from Mexico | Chippewa |
| Minimum | 54.0% | 26.1% |
| Maximum | 100.0% | 100.0% |
| Range | 46.0% | 73.9% |
| Mean | 80.4% | 79.1% |
| Median | 80.3% | 82.3% |
| Interquartile 25% (IQ1) | 77.5% | 70.9% |
| Interquartile 75% (IQ3) | 83.6% | 87.0% |
| Interquartile Range (IQR) | 6.1% | 16.0% |
| Standard Deviation (Sample) | 9.6% | 15.7% |
| Standard Deviation (Population) | 9.6% | 15.7% |
Similar Demographics by In Labor Force | Age 35-44
Demographics Similar to Immigrants from Mexico by In Labor Force | Age 35-44
In terms of in labor force | age 35-44, the demographic groups most similar to Immigrants from Mexico are Cajun (81.5%, a difference of 0.020%), Comanche (81.5%, a difference of 0.020%), Cherokee (81.4%, a difference of 0.10%), Alaska Native (81.6%, a difference of 0.14%), and Mexican (81.6%, a difference of 0.14%).
| Demographics | Rating | Rank | In Labor Force | Age 35-44 |
| Immigrants | Central America | 0.0 /100 | #308 | Tragic 82.0% |
| Cree | 0.0 /100 | #309 | Tragic 82.0% |
| Blackfeet | 0.0 /100 | #310 | Tragic 81.9% |
| Colville | 0.0 /100 | #311 | Tragic 81.7% |
| Alaska Natives | 0.0 /100 | #312 | Tragic 81.6% |
| Mexicans | 0.0 /100 | #313 | Tragic 81.6% |
| Cajuns | 0.0 /100 | #314 | Tragic 81.5% |
| Immigrants | Mexico | 0.0 /100 | #315 | Tragic 81.5% |
| Comanche | 0.0 /100 | #316 | Tragic 81.5% |
| Cherokee | 0.0 /100 | #317 | Tragic 81.4% |
| Alaskan Athabascans | 0.0 /100 | #318 | Tragic 81.3% |
| Inupiat | 0.0 /100 | #319 | Tragic 80.9% |
| Chickasaw | 0.0 /100 | #320 | Tragic 80.9% |
| Puerto Ricans | 0.0 /100 | #321 | Tragic 80.7% |
| Paiute | 0.0 /100 | #322 | Tragic 80.6% |
Demographics Similar to Chippewa by In Labor Force | Age 35-44
In terms of in labor force | age 35-44, the demographic groups most similar to Chippewa are Puget Sound Salish (82.9%, a difference of 0.010%), African (82.9%, a difference of 0.010%), Fijian (82.9%, a difference of 0.030%), Immigrants from Bangladesh (82.9%, a difference of 0.030%), and Immigrants from Belize (82.9%, a difference of 0.030%).
| Demographics | Rating | Rank | In Labor Force | Age 35-44 |
| Osage | 0.0 /100 | #282 | Tragic 82.9% |
| Immigrants | Guatemala | 0.0 /100 | #283 | Tragic 82.9% |
| Immigrants | Dominican Republic | 0.0 /100 | #284 | Tragic 82.9% |
| Fijians | 0.0 /100 | #285 | Tragic 82.9% |
| Immigrants | Bangladesh | 0.0 /100 | #286 | Tragic 82.9% |
| Immigrants | Belize | 0.0 /100 | #287 | Tragic 82.9% |
| Puget Sound Salish | 0.0 /100 | #288 | Tragic 82.9% |
| Chippewa | 0.0 /100 | #289 | Tragic 82.9% |
| Africans | 0.0 /100 | #290 | Tragic 82.9% |
| Pennsylvania Germans | 0.0 /100 | #291 | Tragic 82.9% |
| Immigrants | Latin America | 0.0 /100 | #292 | Tragic 82.8% |
| Spanish Americans | 0.0 /100 | #293 | Tragic 82.8% |
| Potawatomi | 0.0 /100 | #294 | Tragic 82.7% |
| Immigrants | Lebanon | 0.0 /100 | #295 | Tragic 82.7% |
| Mexican American Indians | 0.0 /100 | #296 | Tragic 82.6% |