Immigrants from Latin America vs Pakistani In Labor Force | Age 16-19
COMPARE
Immigrants from Latin America
Pakistani
In Labor Force | Age 16-19
In Labor Force | Age 16-19 Comparison
Immigrants from Latin America
Pakistanis
33.9%
IN LABOR FORCE | AGE 16-19
0.3/ 100
METRIC RATING
276th/ 347
METRIC RANK
37.6%
IN LABOR FORCE | AGE 16-19
89.5/ 100
METRIC RATING
143rd/ 347
METRIC RANK
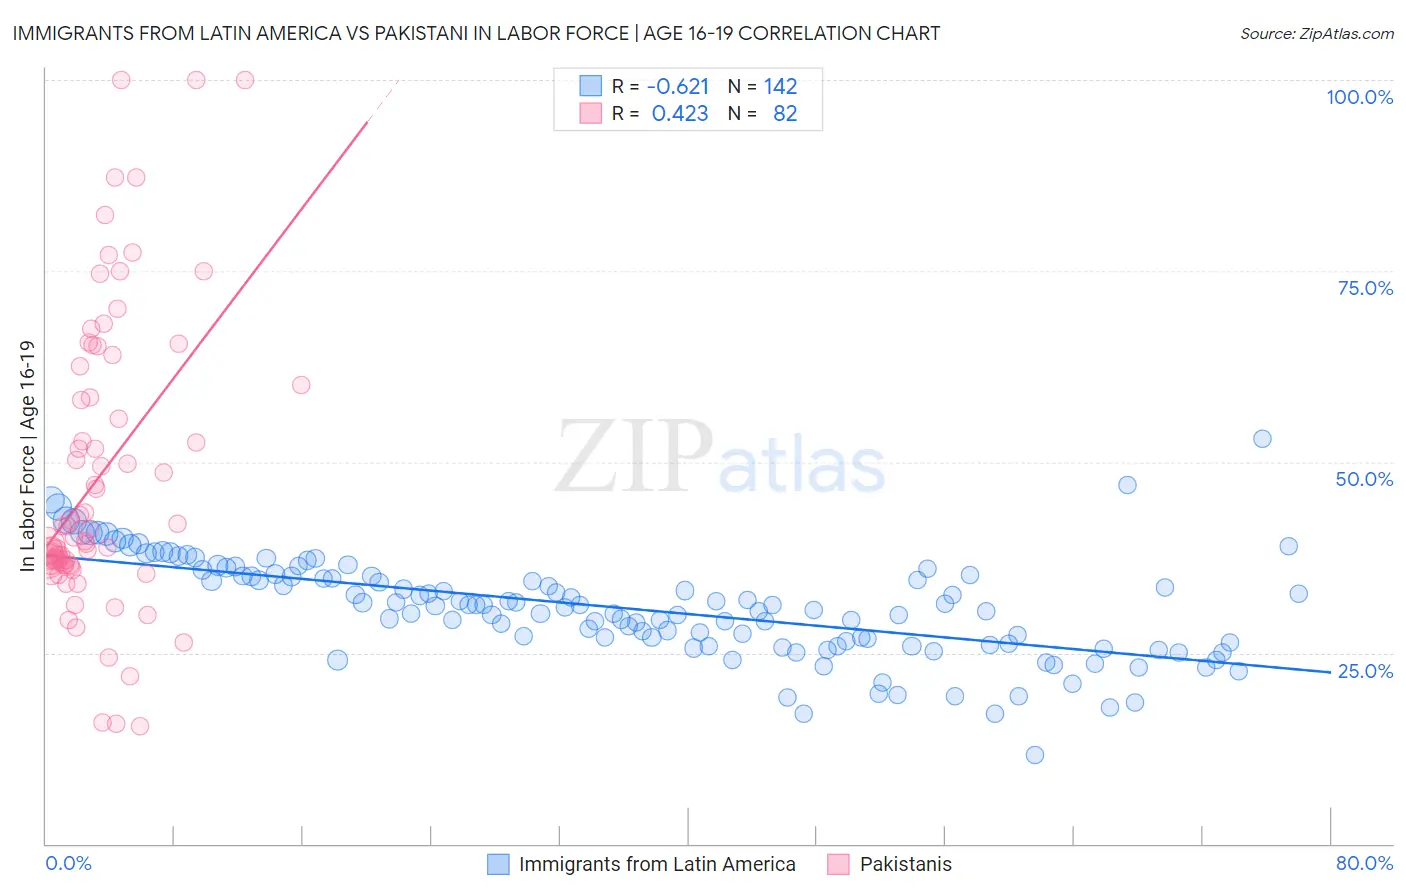
Immigrants from Latin America vs Pakistani In Labor Force | Age 16-19 Correlation Chart
The statistical analysis conducted on geographies consisting of 555,360,667 people shows a significant negative correlation between the proportion of Immigrants from Latin America and labor force participation rate among population between the ages 16 and 19 in the United States with a correlation coefficient (R) of -0.621 and weighted average of 33.9%. Similarly, the statistical analysis conducted on geographies consisting of 335,000,628 people shows a moderate positive correlation between the proportion of Pakistanis and labor force participation rate among population between the ages 16 and 19 in the United States with a correlation coefficient (R) of 0.423 and weighted average of 37.6%, a difference of 10.8%.
In Labor Force | Age 16-19 Correlation Summary
| Measurement | Immigrants from Latin America | Pakistani |
| Minimum | 11.7% | 15.4% |
| Maximum | 53.1% | 100.0% |
| Range | 41.4% | 84.6% |
| Mean | 30.8% | 48.1% |
| Median | 31.2% | 40.7% |
| Interquartile 25% (IQ1) | 26.1% | 36.5% |
| Interquartile 75% (IQ3) | 35.0% | 60.0% |
| Interquartile Range (IQR) | 8.9% | 23.5% |
| Standard Deviation (Sample) | 6.6% | 19.2% |
| Standard Deviation (Population) | 6.6% | 19.1% |
Similar Demographics by In Labor Force | Age 16-19
Demographics Similar to Immigrants from Latin America by In Labor Force | Age 16-19
In terms of in labor force | age 16-19, the demographic groups most similar to Immigrants from Latin America are Immigrants from Fiji (33.9%, a difference of 0.10%), Menominee (33.9%, a difference of 0.11%), Colombian (33.8%, a difference of 0.18%), Venezuelan (34.0%, a difference of 0.20%), and Paraguayan (33.8%, a difference of 0.20%).
| Demographics | Rating | Rank | In Labor Force | Age 16-19 |
| Pima | 0.5 /100 | #269 | Tragic 34.1% |
| Immigrants | Russia | 0.4 /100 | #270 | Tragic 34.1% |
| Central American Indians | 0.4 /100 | #271 | Tragic 34.1% |
| Asians | 0.4 /100 | #272 | Tragic 34.1% |
| Immigrants | Panama | 0.4 /100 | #273 | Tragic 34.0% |
| Venezuelans | 0.3 /100 | #274 | Tragic 34.0% |
| Immigrants | Fiji | 0.3 /100 | #275 | Tragic 33.9% |
| Immigrants | Latin America | 0.3 /100 | #276 | Tragic 33.9% |
| Menominee | 0.3 /100 | #277 | Tragic 33.9% |
| Colombians | 0.3 /100 | #278 | Tragic 33.8% |
| Paraguayans | 0.3 /100 | #279 | Tragic 33.8% |
| Taiwanese | 0.3 /100 | #280 | Tragic 33.8% |
| Cypriots | 0.3 /100 | #281 | Tragic 33.8% |
| Immigrants | Korea | 0.3 /100 | #282 | Tragic 33.8% |
| Immigrants | Venezuela | 0.2 /100 | #283 | Tragic 33.7% |
Demographics Similar to Pakistanis by In Labor Force | Age 16-19
In terms of in labor force | age 16-19, the demographic groups most similar to Pakistanis are Japanese (37.5%, a difference of 0.020%), Paiute (37.5%, a difference of 0.020%), Sierra Leonean (37.6%, a difference of 0.030%), Immigrants from Western Europe (37.5%, a difference of 0.070%), and Brazilian (37.5%, a difference of 0.10%).
| Demographics | Rating | Rank | In Labor Force | Age 16-19 |
| Australians | 93.2 /100 | #136 | Exceptional 37.8% |
| Cajuns | 93.2 /100 | #137 | Exceptional 37.8% |
| Comanche | 91.9 /100 | #138 | Exceptional 37.7% |
| Immigrants | Moldova | 91.9 /100 | #139 | Exceptional 37.7% |
| Estonians | 91.7 /100 | #140 | Exceptional 37.7% |
| Syrians | 90.7 /100 | #141 | Exceptional 37.6% |
| Sierra Leoneans | 89.7 /100 | #142 | Excellent 37.6% |
| Pakistanis | 89.5 /100 | #143 | Excellent 37.6% |
| Japanese | 89.3 /100 | #144 | Excellent 37.5% |
| Paiute | 89.3 /100 | #145 | Excellent 37.5% |
| Immigrants | Western Europe | 88.9 /100 | #146 | Excellent 37.5% |
| Brazilians | 88.7 /100 | #147 | Excellent 37.5% |
| Romanians | 87.3 /100 | #148 | Excellent 37.5% |
| Native Hawaiians | 85.0 /100 | #149 | Excellent 37.4% |
| Tsimshian | 84.7 /100 | #150 | Excellent 37.4% |