Immigrants from Latin America vs Immigrants from Uzbekistan In Labor Force | Age 16-19

COMPARE

Immigrants from Latin America
Race
Ancestry
AfghanAfricanAlaska NativeAlaskan AthabascanAlbanianAleutAlsatianAmericanApacheArabArapahoArgentineanArmenianAssyrian/Chaldean/SyriacAustralianAustrianBahamianBangladeshiBarbadianBasqueBelgianBelizeanBermudanBhutaneseBlackfeetBolivianBrazilianBritishBritish West IndianBulgarianBurmeseCajunCambodianCanadianCape VerdeanCarpatho RusynCelticCentral AmericanCentral American IndianCherokeeCheyenneChickasawChileanChineseChippewaChoctawColombianColvilleComancheCosta RicanCreeCreekCroatianCrowCubanCypriotCzechCzechoslovakianDanishDelawareDominicanDutchDutch West IndianEastern EuropeanEcuadorianEgyptianEnglishEstonianEthiopianEuropeanFijianFilipinoFinnishFrenchFrench American IndianFrench CanadianGermanGerman RussianGhanaianGreekGuamanian/ChamorroGuatemalanGuyaneseHaitianHmongHonduranHopiHoumaHungarianIcelanderIndian (Asian)IndonesianInupiatIranianIraqiIrishIroquoisIsraeliItalianJamaicanJapaneseJordanianKenyanKiowaKoreanLaotianLatvianLebaneseLiberianLithuanianLumbeeLuxembourgerMacedonianMalaysianMalteseMarshalleseMenomineeMexicanMexican American IndianMongolianMoroccanNative HawaiianNavajoNepaleseNew ZealanderNicaraguanNigerianNorthern EuropeanNorwegianOkinawanOsageOttawaPaiutePakistaniPalestinianPanamanianParaguayanPennsylvania GermanPeruvianPimaPolishPortuguesePotawatomiPuebloPuerto RicanPuget Sound SalishRomanianRussianSalvadoranSamoanScandinavianScotch-IrishScottishSeminoleSenegaleseSerbianShoshoneSierra LeoneanSiouxSlavicSlovakSloveneSomaliSouth AfricanSouth AmericanSouth American IndianSoviet UnionSpaniardSpanishSpanish AmericanSpanish American IndianSri LankanSubsaharan AfricanSudaneseSwedishSwissSyrianTaiwaneseThaiTlingit-HaidaTohono O'OdhamTonganTrinidadian and TobagonianTsimshianTurkishU.S. Virgin IslanderUgandanUkrainianUruguayanUteVenezuelanVietnameseWelshWest IndianYakamaYaquiYugoslavianYumanYup'ikZimbabwean
Immigration
NonimmigrantsImmigrantsAfghanistanAfricaAlbaniaArgentinaArmeniaAsiaAustraliaAustriaBahamasBangladeshBarbadosBelarusBelgiumBelizeBoliviaBosnia and HerzegovinaBrazilBulgariaBurma/MyanmarCabo VerdeCambodiaCameroonCanadaCaribbeanCentral AmericaChileChinaColombiaCongoCosta RicaCroatiaCubaCzechoslovakiaDenmarkDominicaDominican RepublicEastern AfricaEastern AsiaEastern EuropeEcuadorEgyptEl SalvadorEnglandEritreaEthiopiaEuropeFijiFranceGermanyGhanaGreeceGrenadaGuatemalaGuyanaHaitiHondurasHong KongHungaryIndiaIndonesiaIranIraqIrelandIsraelItalyJamaicaJapanJordanKazakhstanKenyaKoreaKuwaitLaosLatin AmericaLatviaLebanonLiberiaLithuaniaMalaysiaMexicoMicronesiaMiddle AfricaMoldovaMoroccoNepalNetherlandsNicaraguaNigeriaNorth AmericaNorth MacedoniaNorthern AfricaNorthern EuropeNorwayOceaniaPakistanPanamaPeruPhilippinesPolandPortugalRomaniaRussiaSaudi ArabiaScotlandSenegalSerbiaSierra LeoneSingaporeSomaliaSouth AfricaSouth AmericaSouth Central AsiaSouth Eastern AsiaSouthern EuropeSpainSri LankaSt. Vincent and the GrenadinesSudanSwedenSwitzerlandSyriaTaiwanThailandTrinidad and TobagoTurkeyUgandaUkraineUruguayVenezuelaVietnamWest IndiesWestern AfricaWestern AsiaWestern EuropeYemenZaireZimbabweAzores
Immigrants from Uzbekistan
Race
Ancestry
AfghanAfricanAlaska NativeAlaskan AthabascanAlbanianAleutAlsatianAmericanApacheArabArapahoArgentineanArmenianAssyrian/Chaldean/SyriacAustralianAustrianBahamianBangladeshiBarbadianBasqueBelgianBelizeanBermudanBhutaneseBlackfeetBolivianBrazilianBritishBritish West IndianBulgarianBurmeseCajunCambodianCanadianCape VerdeanCarpatho RusynCelticCentral AmericanCentral American IndianCherokeeCheyenneChickasawChileanChineseChippewaChoctawColombianColvilleComancheCosta RicanCreeCreekCroatianCrowCubanCypriotCzechCzechoslovakianDanishDelawareDominicanDutchDutch West IndianEastern EuropeanEcuadorianEgyptianEnglishEstonianEthiopianEuropeanFijianFilipinoFinnishFrenchFrench American IndianFrench CanadianGermanGerman RussianGhanaianGreekGuamanian/ChamorroGuatemalanGuyaneseHaitianHmongHonduranHopiHoumaHungarianIcelanderIndian (Asian)IndonesianInupiatIranianIraqiIrishIroquoisIsraeliItalianJamaicanJapaneseJordanianKenyanKiowaKoreanLaotianLatvianLebaneseLiberianLithuanianLumbeeLuxembourgerMacedonianMalaysianMalteseMarshalleseMenomineeMexicanMexican American IndianMongolianMoroccanNative HawaiianNavajoNepaleseNew ZealanderNicaraguanNigerianNorthern EuropeanNorwegianOkinawanOsageOttawaPaiutePakistaniPalestinianPanamanianParaguayanPennsylvania GermanPeruvianPimaPolishPortuguesePotawatomiPuebloPuerto RicanPuget Sound SalishRomanianRussianSalvadoranSamoanScandinavianScotch-IrishScottishSeminoleSenegaleseSerbianShoshoneSierra LeoneanSiouxSlavicSlovakSloveneSomaliSouth AfricanSouth AmericanSouth American IndianSoviet UnionSpaniardSpanishSpanish AmericanSpanish American IndianSri LankanSubsaharan AfricanSudaneseSwedishSwissSyrianTaiwaneseThaiTlingit-HaidaTohono O'OdhamTonganTrinidadian and TobagonianTsimshianTurkishU.S. Virgin IslanderUgandanUkrainianUruguayanUteVenezuelanVietnameseWelshWest IndianYakamaYaquiYugoslavianYumanYup'ikZimbabwean
Immigration
NonimmigrantsImmigrantsAfghanistanAfricaAlbaniaArgentinaArmeniaAsiaAustraliaAustriaBahamasBangladeshBarbadosBelarusBelgiumBelizeBoliviaBosnia and HerzegovinaBrazilBulgariaBurma/MyanmarCabo VerdeCambodiaCameroonCanadaCaribbeanCentral AmericaChileChinaColombiaCongoCosta RicaCroatiaCubaCzechoslovakiaDenmarkDominicaDominican RepublicEastern AfricaEastern AsiaEastern EuropeEcuadorEgyptEl SalvadorEnglandEritreaEthiopiaEuropeFijiFranceGermanyGhanaGreeceGrenadaGuatemalaGuyanaHaitiHondurasHong KongHungaryIndiaIndonesiaIranIraqIrelandIsraelItalyJamaicaJapanJordanKazakhstanKenyaKoreaKuwaitLaosLatviaLebanonLiberiaLithuaniaMalaysiaMexicoMicronesiaMiddle AfricaMoldovaMoroccoNepalNetherlandsNicaraguaNigeriaNorth AmericaNorth MacedoniaNorthern AfricaNorthern EuropeNorwayOceaniaPakistanPanamaPeruPhilippinesPolandPortugalRomaniaRussiaSaudi ArabiaScotlandSenegalSerbiaSierra LeoneSingaporeSomaliaSouth AfricaSouth AmericaSouth Central AsiaSouth Eastern AsiaSouthern EuropeSpainSri LankaSt. Vincent and the GrenadinesSudanSwedenSwitzerlandSyriaTaiwanThailandTrinidad and TobagoTurkeyUgandaUkraineUruguayUzbekistanVenezuelaVietnamWest IndiesWestern AfricaWestern AsiaWestern EuropeYemenZaireZimbabweAzores
In Labor Force | Age 16-19
Income
Poverty
Unemployment
Labor Participation
Family Structure
Vehicle Availability
Education Level
Disability

In Labor Force | Age 16-19 Comparison

Immigrants from Latin America

Immigrants from Uzbekistan

Tragic
Tragic
33.9%
IN LABOR FORCE | AGE 16-19
0.3/ 100
METRIC RATING
276th/ 347
METRIC RANK
29.2%
IN LABOR FORCE | AGE 16-19
0.0/ 100
METRIC RATING
339th/ 347
METRIC RANK

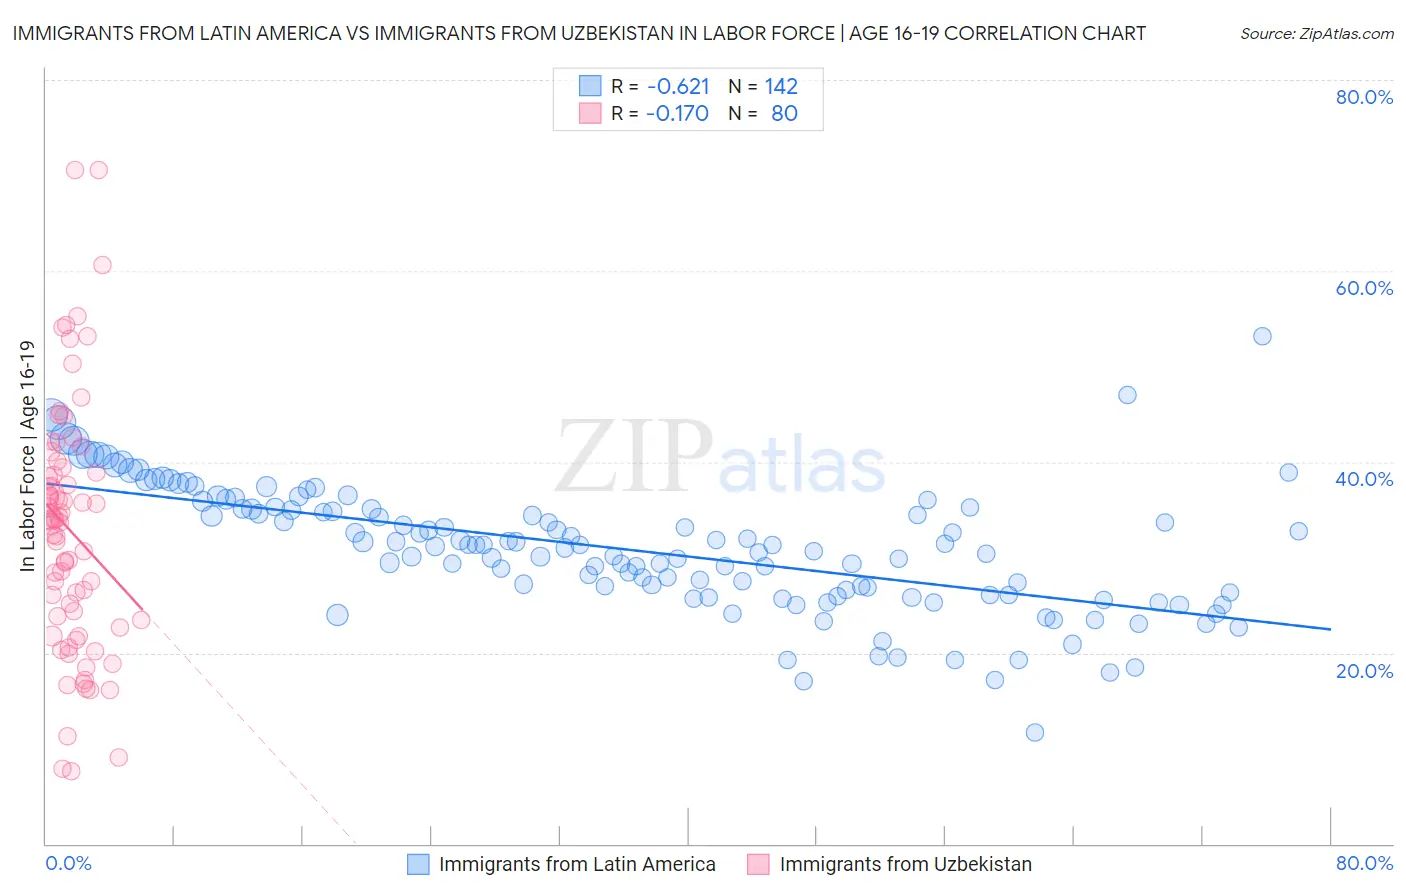
Immigrants from Latin America vs Immigrants from Uzbekistan In Labor Force | Age 16-19 Correlation Chart

The statistical analysis conducted on geographies consisting of 555,360,667 people shows a significant negative correlation between the proportion of Immigrants from Latin America and labor force participation rate among population between the ages 16 and 19 in the United States with a correlation coefficient (R) of -0.621 and weighted average of 33.9%. Similarly, the statistical analysis conducted on geographies consisting of 118,707,763 people shows a poor negative correlation between the proportion of Immigrants from Uzbekistan and labor force participation rate among population between the ages 16 and 19 in the United States with a correlation coefficient (R) of -0.170 and weighted average of 29.2%, a difference of 16.3%.
Immigrants from Latin America vs Immigrants from Uzbekistan In Labor Force | Age 16-19

In Labor Force | Age 16-19 Correlation Summary

MeasurementImmigrants from Latin AmericaImmigrants from Uzbekistan
Minimum11.7%7.6%
Maximum53.1%70.6%
Range41.4%63.0%
Mean30.8%32.8%
Median31.2%33.7%
Interquartile 25% (IQ1)26.1%23.1%
Interquartile 75% (IQ3)35.0%39.2%
Interquartile Range (IQR)8.9%16.1%
Standard Deviation (Sample)6.6%13.1%
Standard Deviation (Population)6.6%13.0%

Similar Demographics by In Labor Force | Age 16-19

Demographics Similar to Immigrants from Latin America by In Labor Force | Age 16-19

In terms of in labor force | age 16-19, the demographic groups most similar to Immigrants from Latin America are Immigrants from Fiji (33.9%, a difference of 0.10%), Menominee (33.9%, a difference of 0.11%), Colombian (33.8%, a difference of 0.18%), Venezuelan (34.0%, a difference of 0.20%), and Paraguayan (33.8%, a difference of 0.20%).
DemographicsRating | RankIn Labor Force | Age 16-19
Pima
0.5
/100
|
#269
Tragic
34.1%
Immigrants | Russia
0.4
/100
|
#270
Tragic
34.1%
Central American Indians
0.4
/100
|
#271
Tragic
34.1%
Asians
0.4
/100
|
#272
Tragic
34.1%
Immigrants | Panama
0.4
/100
|
#273
Tragic
34.0%
Venezuelans
0.3
/100
|
#274
Tragic
34.0%
Immigrants | Fiji
0.3
/100
|
#275
Tragic
33.9%
Immigrants | Latin America
0.3
/100
|
#276
Tragic
33.9%
Menominee
0.3
/100
|
#277
Tragic
33.9%
Colombians
0.3
/100
|
#278
Tragic
33.8%
Paraguayans
0.3
/100
|
#279
Tragic
33.8%
Taiwanese
0.3
/100
|
#280
Tragic
33.8%
Cypriots
0.3
/100
|
#281
Tragic
33.8%
Immigrants | Korea
0.3
/100
|
#282
Tragic
33.8%
Immigrants | Venezuela
0.2
/100
|
#283
Tragic
33.7%

Demographics Similar to Immigrants from Uzbekistan by In Labor Force | Age 16-19

In terms of in labor force | age 16-19, the demographic groups most similar to Immigrants from Uzbekistan are British West Indian (29.1%, a difference of 0.20%), Immigrants from Armenia (29.0%, a difference of 0.43%), Immigrants from Barbados (29.0%, a difference of 0.58%), Vietnamese (29.6%, a difference of 1.4%), and Immigrants from Bangladesh (30.0%, a difference of 3.1%).
DemographicsRating | RankIn Labor Force | Age 16-19
Immigrants | Israel
0.0
/100
|
#332
Tragic
30.5%
Immigrants | Hong Kong
0.0
/100
|
#333
Tragic
30.5%
Puerto Ricans
0.0
/100
|
#334
Tragic
30.3%
Immigrants | Cuba
0.0
/100
|
#335
Tragic
30.2%
Immigrants | Trinidad and Tobago
0.0
/100
|
#336
Tragic
30.2%
Immigrants | Bangladesh
0.0
/100
|
#337
Tragic
30.0%
Vietnamese
0.0
/100
|
#338
Tragic
29.6%
Immigrants | Uzbekistan
0.0
/100
|
#339
Tragic
29.2%
British West Indians
0.0
/100
|
#340
Tragic
29.1%
Immigrants | Armenia
0.0
/100
|
#341
Tragic
29.0%
Immigrants | Barbados
0.0
/100
|
#342
Tragic
29.0%
Yuman
0.0
/100
|
#343
Tragic
27.7%
Guyanese
0.0
/100
|
#344
Tragic
27.4%
Immigrants | Guyana
0.0
/100
|
#345
Tragic
27.3%
Immigrants | St. Vincent and the Grenadines
0.0
/100
|
#346
Tragic
26.3%