Immigrants from Jamaica vs Immigrants from Ghana In Labor Force | Age 45-54

COMPARE

Immigrants from Jamaica
Race
Ancestry
AfghanAfricanAlaska NativeAlaskan AthabascanAlbanianAleutAlsatianAmericanApacheArabArapahoArgentineanArmenianAssyrian/Chaldean/SyriacAustralianAustrianBahamianBangladeshiBarbadianBasqueBelgianBelizeanBermudanBhutaneseBlackfeetBolivianBrazilianBritishBritish West IndianBulgarianBurmeseCajunCambodianCanadianCape VerdeanCarpatho RusynCelticCentral AmericanCentral American IndianCherokeeCheyenneChickasawChileanChineseChippewaChoctawColombianColvilleComancheCosta RicanCreeCreekCroatianCrowCubanCypriotCzechCzechoslovakianDanishDelawareDominicanDutchDutch West IndianEastern EuropeanEcuadorianEgyptianEnglishEstonianEthiopianEuropeanFijianFilipinoFinnishFrenchFrench American IndianFrench CanadianGermanGerman RussianGhanaianGreekGuamanian/ChamorroGuatemalanGuyaneseHaitianHmongHonduranHopiHoumaHungarianIcelanderIndian (Asian)IndonesianInupiatIranianIraqiIrishIroquoisIsraeliItalianJamaicanJapaneseJordanianKenyanKiowaKoreanLaotianLatvianLebaneseLiberianLithuanianLumbeeLuxembourgerMacedonianMalaysianMalteseMarshalleseMenomineeMexicanMexican American IndianMongolianMoroccanNative HawaiianNavajoNepaleseNew ZealanderNicaraguanNigerianNorthern EuropeanNorwegianOkinawanOsageOttawaPaiutePakistaniPalestinianPanamanianParaguayanPennsylvania GermanPeruvianPimaPolishPortuguesePotawatomiPuebloPuerto RicanPuget Sound SalishRomanianRussianSalvadoranSamoanScandinavianScotch-IrishScottishSeminoleSenegaleseSerbianShoshoneSierra LeoneanSiouxSlavicSlovakSloveneSomaliSouth AfricanSouth AmericanSouth American IndianSoviet UnionSpaniardSpanishSpanish AmericanSpanish American IndianSri LankanSubsaharan AfricanSudaneseSwedishSwissSyrianTaiwaneseThaiTlingit-HaidaTohono O'OdhamTonganTrinidadian and TobagonianTsimshianTurkishU.S. Virgin IslanderUgandanUkrainianUruguayanUteVenezuelanVietnameseWelshWest IndianYakamaYaquiYugoslavianYumanYup'ikZimbabwean
Immigration
NonimmigrantsImmigrantsAfghanistanAfricaAlbaniaArgentinaArmeniaAsiaAustraliaAustriaBahamasBangladeshBarbadosBelarusBelgiumBelizeBoliviaBosnia and HerzegovinaBrazilBulgariaBurma/MyanmarCabo VerdeCambodiaCameroonCanadaCaribbeanCentral AmericaChileChinaColombiaCongoCosta RicaCroatiaCubaCzechoslovakiaDenmarkDominicaDominican RepublicEastern AfricaEastern AsiaEastern EuropeEcuadorEgyptEl SalvadorEnglandEritreaEthiopiaEuropeFijiFranceGermanyGreeceGrenadaGuatemalaGuyanaHaitiHondurasHong KongHungaryIndiaIndonesiaIranIraqIrelandIsraelItalyJamaicaJapanJordanKazakhstanKenyaKoreaKuwaitLaosLatin AmericaLatviaLebanonLiberiaLithuaniaMalaysiaMexicoMicronesiaMiddle AfricaMoldovaMoroccoNepalNetherlandsNicaraguaNigeriaNorth AmericaNorth MacedoniaNorthern AfricaNorthern EuropeNorwayOceaniaPakistanPanamaPeruPhilippinesPolandPortugalRomaniaRussiaSaudi ArabiaScotlandSenegalSerbiaSierra LeoneSingaporeSomaliaSouth AfricaSouth AmericaSouth Central AsiaSouth Eastern AsiaSouthern EuropeSpainSri LankaSt. Vincent and the GrenadinesSudanSwedenSwitzerlandSyriaTaiwanThailandTrinidad and TobagoTurkeyUgandaUkraineUruguayUzbekistanVenezuelaVietnamWest IndiesWestern AfricaWestern AsiaWestern EuropeYemenZaireZimbabweAzores
Immigrants from Ghana
Race
Ancestry
AfghanAfricanAlaska NativeAlaskan AthabascanAlbanianAleutAlsatianAmericanApacheArabArapahoArgentineanArmenianAssyrian/Chaldean/SyriacAustralianAustrianBahamianBangladeshiBarbadianBasqueBelgianBelizeanBermudanBhutaneseBlackfeetBolivianBrazilianBritishBritish West IndianBulgarianBurmeseCajunCambodianCanadianCape VerdeanCarpatho RusynCelticCentral AmericanCentral American IndianCherokeeCheyenneChickasawChileanChineseChippewaChoctawColombianColvilleComancheCosta RicanCreeCreekCroatianCrowCubanCypriotCzechCzechoslovakianDanishDelawareDominicanDutchDutch West IndianEastern EuropeanEcuadorianEgyptianEnglishEstonianEthiopianEuropeanFijianFilipinoFinnishFrenchFrench American IndianFrench CanadianGermanGerman RussianGhanaianGreekGuamanian/ChamorroGuatemalanGuyaneseHaitianHmongHonduranHopiHoumaHungarianIcelanderIndian (Asian)IndonesianInupiatIranianIraqiIrishIroquoisIsraeliItalianJamaicanJapaneseJordanianKenyanKiowaKoreanLaotianLatvianLebaneseLiberianLithuanianLumbeeLuxembourgerMacedonianMalaysianMalteseMarshalleseMenomineeMexicanMexican American IndianMongolianMoroccanNative HawaiianNavajoNepaleseNew ZealanderNicaraguanNigerianNorthern EuropeanNorwegianOkinawanOsageOttawaPaiutePakistaniPalestinianPanamanianParaguayanPennsylvania GermanPeruvianPimaPolishPortuguesePotawatomiPuebloPuerto RicanPuget Sound SalishRomanianRussianSalvadoranSamoanScandinavianScotch-IrishScottishSeminoleSenegaleseSerbianShoshoneSierra LeoneanSiouxSlavicSlovakSloveneSomaliSouth AfricanSouth AmericanSouth American IndianSoviet UnionSpaniardSpanishSpanish AmericanSpanish American IndianSri LankanSubsaharan AfricanSudaneseSwedishSwissSyrianTaiwaneseThaiTlingit-HaidaTohono O'OdhamTonganTrinidadian and TobagonianTsimshianTurkishU.S. Virgin IslanderUgandanUkrainianUruguayanUteVenezuelanVietnameseWelshWest IndianYakamaYaquiYugoslavianYumanYup'ikZimbabwean
Immigration
NonimmigrantsImmigrantsAfghanistanAfricaAlbaniaArgentinaArmeniaAsiaAustraliaAustriaBahamasBangladeshBarbadosBelarusBelgiumBelizeBoliviaBosnia and HerzegovinaBrazilBulgariaBurma/MyanmarCabo VerdeCambodiaCameroonCanadaCaribbeanCentral AmericaChileChinaColombiaCongoCosta RicaCroatiaCubaCzechoslovakiaDenmarkDominicaDominican RepublicEastern AfricaEastern AsiaEastern EuropeEcuadorEgyptEl SalvadorEnglandEritreaEthiopiaEuropeFijiFranceGermanyGhanaGreeceGrenadaGuatemalaGuyanaHaitiHondurasHong KongHungaryIndiaIndonesiaIranIraqIrelandIsraelItalyJapanJordanKazakhstanKenyaKoreaKuwaitLaosLatin AmericaLatviaLebanonLiberiaLithuaniaMalaysiaMexicoMicronesiaMiddle AfricaMoldovaMoroccoNepalNetherlandsNicaraguaNigeriaNorth AmericaNorth MacedoniaNorthern AfricaNorthern EuropeNorwayOceaniaPakistanPanamaPeruPhilippinesPolandPortugalRomaniaRussiaSaudi ArabiaScotlandSenegalSerbiaSierra LeoneSingaporeSomaliaSouth AfricaSouth AmericaSouth Central AsiaSouth Eastern AsiaSouthern EuropeSpainSri LankaSt. Vincent and the GrenadinesSudanSwedenSwitzerlandSyriaTaiwanThailandTrinidad and TobagoTurkeyUgandaUkraineUruguayUzbekistanVenezuelaVietnamWest IndiesWestern AfricaWestern AsiaWestern EuropeYemenZaireZimbabweAzores
In Labor Force | Age 45-54
Income
Poverty
Unemployment
Labor Participation
Family Structure
Vehicle Availability
Education Level
Disability

In Labor Force | Age 45-54 Comparison

Immigrants from Jamaica

Immigrants from Ghana

Tragic
Good
82.1%
IN LABOR FORCE | AGE 45-54
2.7/ 100
METRIC RATING
224th/ 347
METRIC RANK
82.9%
IN LABOR FORCE | AGE 45-54
70.3/ 100
METRIC RATING
154th/ 347
METRIC RANK

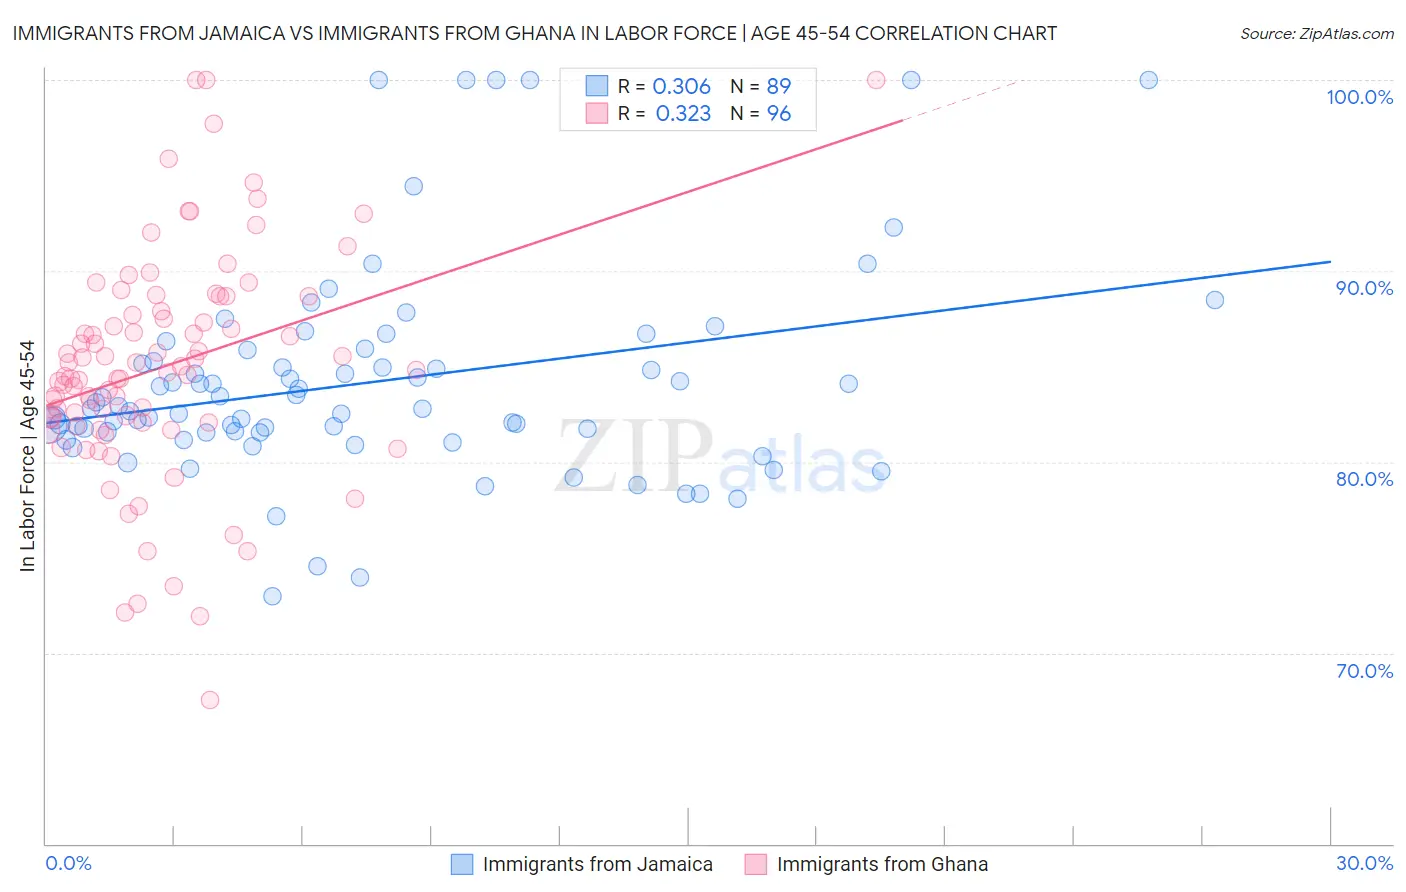
Immigrants from Jamaica vs Immigrants from Ghana In Labor Force | Age 45-54 Correlation Chart

The statistical analysis conducted on geographies consisting of 301,584,451 people shows a mild positive correlation between the proportion of Immigrants from Jamaica and labor force participation rate among population between the ages 45 and 54 in the United States with a correlation coefficient (R) of 0.306 and weighted average of 82.1%. Similarly, the statistical analysis conducted on geographies consisting of 199,808,244 people shows a mild positive correlation between the proportion of Immigrants from Ghana and labor force participation rate among population between the ages 45 and 54 in the United States with a correlation coefficient (R) of 0.323 and weighted average of 82.9%, a difference of 0.99%.
Immigrants from Jamaica vs Immigrants from Ghana In Labor Force | Age 45-54

In Labor Force | Age 45-54 Correlation Summary

MeasurementImmigrants from JamaicaImmigrants from Ghana
Minimum73.0%67.5%
Maximum100.0%100.0%
Range27.0%32.5%
Mean84.2%85.0%
Median82.8%84.7%
Interquartile 25% (IQ1)81.5%82.1%
Interquartile 75% (IQ3)85.5%88.3%
Interquartile Range (IQR)4.0%6.2%
Standard Deviation (Sample)5.6%6.0%
Standard Deviation (Population)5.5%5.9%

Similar Demographics by In Labor Force | Age 45-54

Demographics Similar to Immigrants from Jamaica by In Labor Force | Age 45-54

In terms of in labor force | age 45-54, the demographic groups most similar to Immigrants from Jamaica are Immigrants from Oceania (82.1%, a difference of 0.020%), Immigrants from Caribbean (82.1%, a difference of 0.020%), Immigrants (82.1%, a difference of 0.030%), Immigrants from Germany (82.1%, a difference of 0.030%), and Panamanian (82.2%, a difference of 0.060%).
DemographicsRating | RankIn Labor Force | Age 45-54
Portuguese
4.7
/100
|
#217
Tragic
82.2%
English
4.4
/100
|
#218
Tragic
82.2%
French
4.1
/100
|
#219
Tragic
82.2%
Bahamians
3.6
/100
|
#220
Tragic
82.2%
Panamanians
3.5
/100
|
#221
Tragic
82.2%
Immigrants | Ecuador
3.4
/100
|
#222
Tragic
82.2%
Immigrants | Immigrants
3.1
/100
|
#223
Tragic
82.1%
Immigrants | Jamaica
2.7
/100
|
#224
Tragic
82.1%
Immigrants | Oceania
2.5
/100
|
#225
Tragic
82.1%
Immigrants | Caribbean
2.5
/100
|
#226
Tragic
82.1%
Immigrants | Germany
2.4
/100
|
#227
Tragic
82.1%
Cape Verdeans
2.1
/100
|
#228
Tragic
82.1%
Immigrants | Burma/Myanmar
1.9
/100
|
#229
Tragic
82.0%
Jamaicans
1.8
/100
|
#230
Tragic
82.0%
Immigrants | Senegal
1.7
/100
|
#231
Tragic
82.0%

Demographics Similar to Immigrants from Ghana by In Labor Force | Age 45-54

In terms of in labor force | age 45-54, the demographic groups most similar to Immigrants from Ghana are Immigrants from Indonesia (82.9%, a difference of 0.0%), Slavic (82.9%, a difference of 0.010%), Immigrants from Philippines (82.9%, a difference of 0.010%), Immigrants from Netherlands (82.9%, a difference of 0.020%), and Korean (82.9%, a difference of 0.020%).
DemographicsRating | RankIn Labor Force | Age 45-54
Czechoslovakians
74.8
/100
|
#147
Good
83.0%
Immigrants | Nigeria
74.1
/100
|
#148
Good
83.0%
Immigrants | Sweden
73.3
/100
|
#149
Good
82.9%
Immigrants | Netherlands
72.6
/100
|
#150
Good
82.9%
Koreans
71.9
/100
|
#151
Good
82.9%
Slavs
71.5
/100
|
#152
Good
82.9%
Immigrants | Indonesia
70.6
/100
|
#153
Good
82.9%
Immigrants | Ghana
70.3
/100
|
#154
Good
82.9%
Immigrants | Philippines
69.0
/100
|
#155
Good
82.9%
Immigrants | Saudi Arabia
68.8
/100
|
#156
Good
82.9%
Immigrants | Australia
68.2
/100
|
#157
Good
82.9%
Immigrants | Southern Europe
67.8
/100
|
#158
Good
82.9%
Immigrants | Austria
64.6
/100
|
#159
Good
82.9%
Laotians
62.8
/100
|
#160
Good
82.9%
South American Indians
62.2
/100
|
#161
Good
82.9%