Immigrants from Jamaica vs Immigrants from Ghana In Labor Force | Age 20-64

COMPARE

Immigrants from Jamaica
Race
Ancestry
AfghanAfricanAlaska NativeAlaskan AthabascanAlbanianAleutAlsatianAmericanApacheArabArapahoArgentineanArmenianAssyrian/Chaldean/SyriacAustralianAustrianBahamianBangladeshiBarbadianBasqueBelgianBelizeanBermudanBhutaneseBlackfeetBolivianBrazilianBritishBritish West IndianBulgarianBurmeseCajunCambodianCanadianCape VerdeanCarpatho RusynCelticCentral AmericanCentral American IndianCherokeeCheyenneChickasawChileanChineseChippewaChoctawColombianColvilleComancheCosta RicanCreeCreekCroatianCrowCubanCypriotCzechCzechoslovakianDanishDelawareDominicanDutchDutch West IndianEastern EuropeanEcuadorianEgyptianEnglishEstonianEthiopianEuropeanFijianFilipinoFinnishFrenchFrench American IndianFrench CanadianGermanGerman RussianGhanaianGreekGuamanian/ChamorroGuatemalanGuyaneseHaitianHmongHonduranHopiHoumaHungarianIcelanderIndian (Asian)IndonesianInupiatIranianIraqiIrishIroquoisIsraeliItalianJamaicanJapaneseJordanianKenyanKiowaKoreanLaotianLatvianLebaneseLiberianLithuanianLumbeeLuxembourgerMacedonianMalaysianMalteseMarshalleseMenomineeMexicanMexican American IndianMongolianMoroccanNative HawaiianNavajoNepaleseNew ZealanderNicaraguanNigerianNorthern EuropeanNorwegianOkinawanOsageOttawaPaiutePakistaniPalestinianPanamanianParaguayanPennsylvania GermanPeruvianPimaPolishPortuguesePotawatomiPuebloPuerto RicanPuget Sound SalishRomanianRussianSalvadoranSamoanScandinavianScotch-IrishScottishSeminoleSenegaleseSerbianShoshoneSierra LeoneanSiouxSlavicSlovakSloveneSomaliSouth AfricanSouth AmericanSouth American IndianSoviet UnionSpaniardSpanishSpanish AmericanSpanish American IndianSri LankanSubsaharan AfricanSudaneseSwedishSwissSyrianTaiwaneseThaiTlingit-HaidaTohono O'OdhamTonganTrinidadian and TobagonianTsimshianTurkishU.S. Virgin IslanderUgandanUkrainianUruguayanUteVenezuelanVietnameseWelshWest IndianYakamaYaquiYugoslavianYumanYup'ikZimbabwean
Immigration
NonimmigrantsImmigrantsAfghanistanAfricaAlbaniaArgentinaArmeniaAsiaAustraliaAustriaBahamasBangladeshBarbadosBelarusBelgiumBelizeBoliviaBosnia and HerzegovinaBrazilBulgariaBurma/MyanmarCabo VerdeCambodiaCameroonCanadaCaribbeanCentral AmericaChileChinaColombiaCongoCosta RicaCroatiaCubaCzechoslovakiaDenmarkDominicaDominican RepublicEastern AfricaEastern AsiaEastern EuropeEcuadorEgyptEl SalvadorEnglandEritreaEthiopiaEuropeFijiFranceGermanyGreeceGrenadaGuatemalaGuyanaHaitiHondurasHong KongHungaryIndiaIndonesiaIranIraqIrelandIsraelItalyJamaicaJapanJordanKazakhstanKenyaKoreaKuwaitLaosLatin AmericaLatviaLebanonLiberiaLithuaniaMalaysiaMexicoMicronesiaMiddle AfricaMoldovaMoroccoNepalNetherlandsNicaraguaNigeriaNorth AmericaNorth MacedoniaNorthern AfricaNorthern EuropeNorwayOceaniaPakistanPanamaPeruPhilippinesPolandPortugalRomaniaRussiaSaudi ArabiaScotlandSenegalSerbiaSierra LeoneSingaporeSomaliaSouth AfricaSouth AmericaSouth Central AsiaSouth Eastern AsiaSouthern EuropeSpainSri LankaSt. Vincent and the GrenadinesSudanSwedenSwitzerlandSyriaTaiwanThailandTrinidad and TobagoTurkeyUgandaUkraineUruguayUzbekistanVenezuelaVietnamWest IndiesWestern AfricaWestern AsiaWestern EuropeYemenZaireZimbabweAzores
Immigrants from Ghana
Race
Ancestry
AfghanAfricanAlaska NativeAlaskan AthabascanAlbanianAleutAlsatianAmericanApacheArabArapahoArgentineanArmenianAssyrian/Chaldean/SyriacAustralianAustrianBahamianBangladeshiBarbadianBasqueBelgianBelizeanBermudanBhutaneseBlackfeetBolivianBrazilianBritishBritish West IndianBulgarianBurmeseCajunCambodianCanadianCape VerdeanCarpatho RusynCelticCentral AmericanCentral American IndianCherokeeCheyenneChickasawChileanChineseChippewaChoctawColombianColvilleComancheCosta RicanCreeCreekCroatianCrowCubanCypriotCzechCzechoslovakianDanishDelawareDominicanDutchDutch West IndianEastern EuropeanEcuadorianEgyptianEnglishEstonianEthiopianEuropeanFijianFilipinoFinnishFrenchFrench American IndianFrench CanadianGermanGerman RussianGhanaianGreekGuamanian/ChamorroGuatemalanGuyaneseHaitianHmongHonduranHopiHoumaHungarianIcelanderIndian (Asian)IndonesianInupiatIranianIraqiIrishIroquoisIsraeliItalianJamaicanJapaneseJordanianKenyanKiowaKoreanLaotianLatvianLebaneseLiberianLithuanianLumbeeLuxembourgerMacedonianMalaysianMalteseMarshalleseMenomineeMexicanMexican American IndianMongolianMoroccanNative HawaiianNavajoNepaleseNew ZealanderNicaraguanNigerianNorthern EuropeanNorwegianOkinawanOsageOttawaPaiutePakistaniPalestinianPanamanianParaguayanPennsylvania GermanPeruvianPimaPolishPortuguesePotawatomiPuebloPuerto RicanPuget Sound SalishRomanianRussianSalvadoranSamoanScandinavianScotch-IrishScottishSeminoleSenegaleseSerbianShoshoneSierra LeoneanSiouxSlavicSlovakSloveneSomaliSouth AfricanSouth AmericanSouth American IndianSoviet UnionSpaniardSpanishSpanish AmericanSpanish American IndianSri LankanSubsaharan AfricanSudaneseSwedishSwissSyrianTaiwaneseThaiTlingit-HaidaTohono O'OdhamTonganTrinidadian and TobagonianTsimshianTurkishU.S. Virgin IslanderUgandanUkrainianUruguayanUteVenezuelanVietnameseWelshWest IndianYakamaYaquiYugoslavianYumanYup'ikZimbabwean
Immigration
NonimmigrantsImmigrantsAfghanistanAfricaAlbaniaArgentinaArmeniaAsiaAustraliaAustriaBahamasBangladeshBarbadosBelarusBelgiumBelizeBoliviaBosnia and HerzegovinaBrazilBulgariaBurma/MyanmarCabo VerdeCambodiaCameroonCanadaCaribbeanCentral AmericaChileChinaColombiaCongoCosta RicaCroatiaCubaCzechoslovakiaDenmarkDominicaDominican RepublicEastern AfricaEastern AsiaEastern EuropeEcuadorEgyptEl SalvadorEnglandEritreaEthiopiaEuropeFijiFranceGermanyGhanaGreeceGrenadaGuatemalaGuyanaHaitiHondurasHong KongHungaryIndiaIndonesiaIranIraqIrelandIsraelItalyJapanJordanKazakhstanKenyaKoreaKuwaitLaosLatin AmericaLatviaLebanonLiberiaLithuaniaMalaysiaMexicoMicronesiaMiddle AfricaMoldovaMoroccoNepalNetherlandsNicaraguaNigeriaNorth AmericaNorth MacedoniaNorthern AfricaNorthern EuropeNorwayOceaniaPakistanPanamaPeruPhilippinesPolandPortugalRomaniaRussiaSaudi ArabiaScotlandSenegalSerbiaSierra LeoneSingaporeSomaliaSouth AfricaSouth AmericaSouth Central AsiaSouth Eastern AsiaSouthern EuropeSpainSri LankaSt. Vincent and the GrenadinesSudanSwedenSwitzerlandSyriaTaiwanThailandTrinidad and TobagoTurkeyUgandaUkraineUruguayUzbekistanVenezuelaVietnamWest IndiesWestern AfricaWestern AsiaWestern EuropeYemenZaireZimbabweAzores
In Labor Force | Age 20-64
Income
Poverty
Unemployment
Labor Participation
Family Structure
Vehicle Availability
Education Level
Disability

In Labor Force | Age 20-64 Comparison

Immigrants from Jamaica

Immigrants from Ghana

Tragic
Exceptional
79.0%
IN LABOR FORCE | AGE 20-64
2.6/ 100
METRIC RATING
238th/ 347
METRIC RANK
80.0%
IN LABOR FORCE | AGE 20-64
95.0/ 100
METRIC RATING
105th/ 347
METRIC RANK

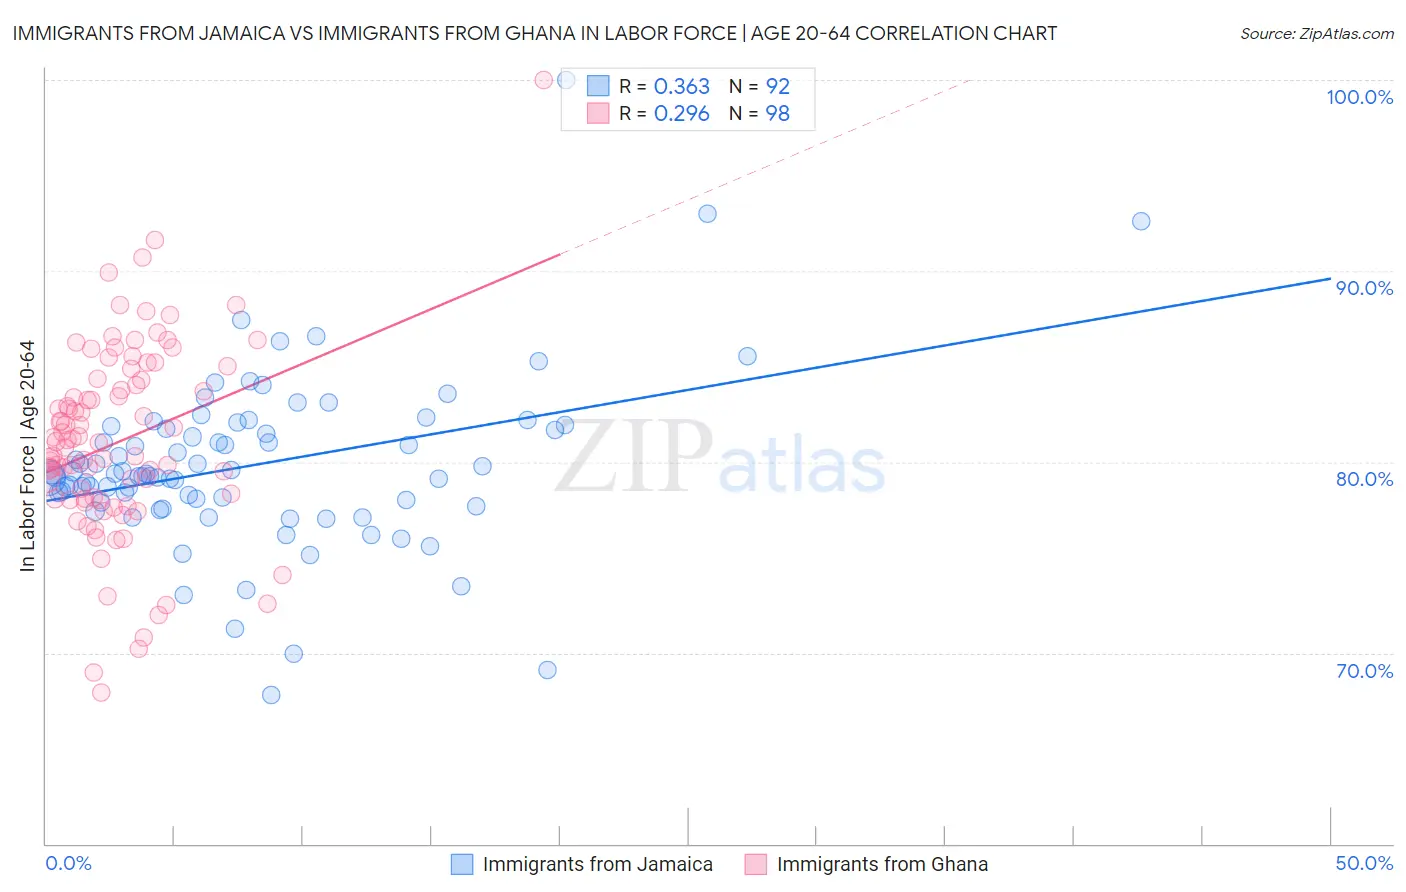
Immigrants from Jamaica vs Immigrants from Ghana In Labor Force | Age 20-64 Correlation Chart

The statistical analysis conducted on geographies consisting of 301,819,494 people shows a mild positive correlation between the proportion of Immigrants from Jamaica and labor force participation rate among population between the ages 20 and 64 in the United States with a correlation coefficient (R) of 0.363 and weighted average of 79.0%. Similarly, the statistical analysis conducted on geographies consisting of 199,964,545 people shows a weak positive correlation between the proportion of Immigrants from Ghana and labor force participation rate among population between the ages 20 and 64 in the United States with a correlation coefficient (R) of 0.296 and weighted average of 80.0%, a difference of 1.3%.
Immigrants from Jamaica vs Immigrants from Ghana In Labor Force | Age 20-64

In Labor Force | Age 20-64 Correlation Summary

MeasurementImmigrants from JamaicaImmigrants from Ghana
Minimum67.8%67.9%
Maximum100.0%100.0%
Range32.2%32.1%
Mean79.8%81.1%
Median79.3%81.0%
Interquartile 25% (IQ1)77.9%78.0%
Interquartile 75% (IQ3)81.8%84.3%
Interquartile Range (IQR)3.9%6.3%
Standard Deviation (Sample)4.5%5.1%
Standard Deviation (Population)4.5%5.0%

Similar Demographics by In Labor Force | Age 20-64

Demographics Similar to Immigrants from Jamaica by In Labor Force | Age 20-64

In terms of in labor force | age 20-64, the demographic groups most similar to Immigrants from Jamaica are Immigrants from North America (79.0%, a difference of 0.020%), Welsh (79.0%, a difference of 0.020%), Trinidadian and Tobagonian (79.0%, a difference of 0.020%), Samoan (79.0%, a difference of 0.030%), and Tlingit-Haida (79.0%, a difference of 0.040%).
DemographicsRating | RankIn Labor Force | Age 20-64
Lebanese
5.1
/100
|
#231
Tragic
79.1%
Guamanians/Chamorros
4.5
/100
|
#232
Tragic
79.1%
Japanese
4.0
/100
|
#233
Tragic
79.1%
Immigrants | Canada
3.2
/100
|
#234
Tragic
79.0%
Tlingit-Haida
3.2
/100
|
#235
Tragic
79.0%
Samoans
2.9
/100
|
#236
Tragic
79.0%
Immigrants | North America
2.9
/100
|
#237
Tragic
79.0%
Immigrants | Jamaica
2.6
/100
|
#238
Tragic
79.0%
Welsh
2.4
/100
|
#239
Tragic
79.0%
Trinidadians and Tobagonians
2.3
/100
|
#240
Tragic
79.0%
Jamaicans
2.0
/100
|
#241
Tragic
78.9%
Immigrants | Micronesia
1.9
/100
|
#242
Tragic
78.9%
Immigrants | West Indies
1.7
/100
|
#243
Tragic
78.9%
French
1.5
/100
|
#244
Tragic
78.9%
Scottish
1.3
/100
|
#245
Tragic
78.9%

Demographics Similar to Immigrants from Ghana by In Labor Force | Age 20-64

In terms of in labor force | age 20-64, the demographic groups most similar to Immigrants from Ghana are Venezuelan (80.0%, a difference of 0.010%), Greek (80.0%, a difference of 0.010%), Immigrants from Jordan (80.0%, a difference of 0.010%), Palestinian (80.0%, a difference of 0.020%), and Immigrants from Australia (80.0%, a difference of 0.020%).
DemographicsRating | RankIn Labor Force | Age 20-64
Immigrants | Uruguay
95.8
/100
|
#98
Exceptional
80.1%
Immigrants | Chile
95.7
/100
|
#99
Exceptional
80.1%
Filipinos
95.6
/100
|
#100
Exceptional
80.1%
Palestinians
95.5
/100
|
#101
Exceptional
80.0%
Immigrants | Australia
95.5
/100
|
#102
Exceptional
80.0%
Russians
95.5
/100
|
#103
Exceptional
80.0%
Venezuelans
95.3
/100
|
#104
Exceptional
80.0%
Immigrants | Ghana
95.0
/100
|
#105
Exceptional
80.0%
Greeks
94.8
/100
|
#106
Exceptional
80.0%
Immigrants | Jordan
94.8
/100
|
#107
Exceptional
80.0%
Iranians
94.3
/100
|
#108
Exceptional
80.0%
Immigrants | Argentina
94.1
/100
|
#109
Exceptional
80.0%
Estonians
94.0
/100
|
#110
Exceptional
80.0%
Immigrants | South America
93.9
/100
|
#111
Exceptional
80.0%
Immigrants | Italy
93.9
/100
|
#112
Exceptional
80.0%