Immigrants from Iraq vs Jordanian In Labor Force | Age 16-19
COMPARE
Immigrants from Iraq
Jordanian
In Labor Force | Age 16-19
In Labor Force | Age 16-19 Comparison
Immigrants from Iraq
Jordanians
39.4%
IN LABOR FORCE | AGE 16-19
99.8/ 100
METRIC RATING
80th/ 347
METRIC RANK
36.4%
IN LABOR FORCE | AGE 16-19
39.6/ 100
METRIC RATING
181st/ 347
METRIC RANK
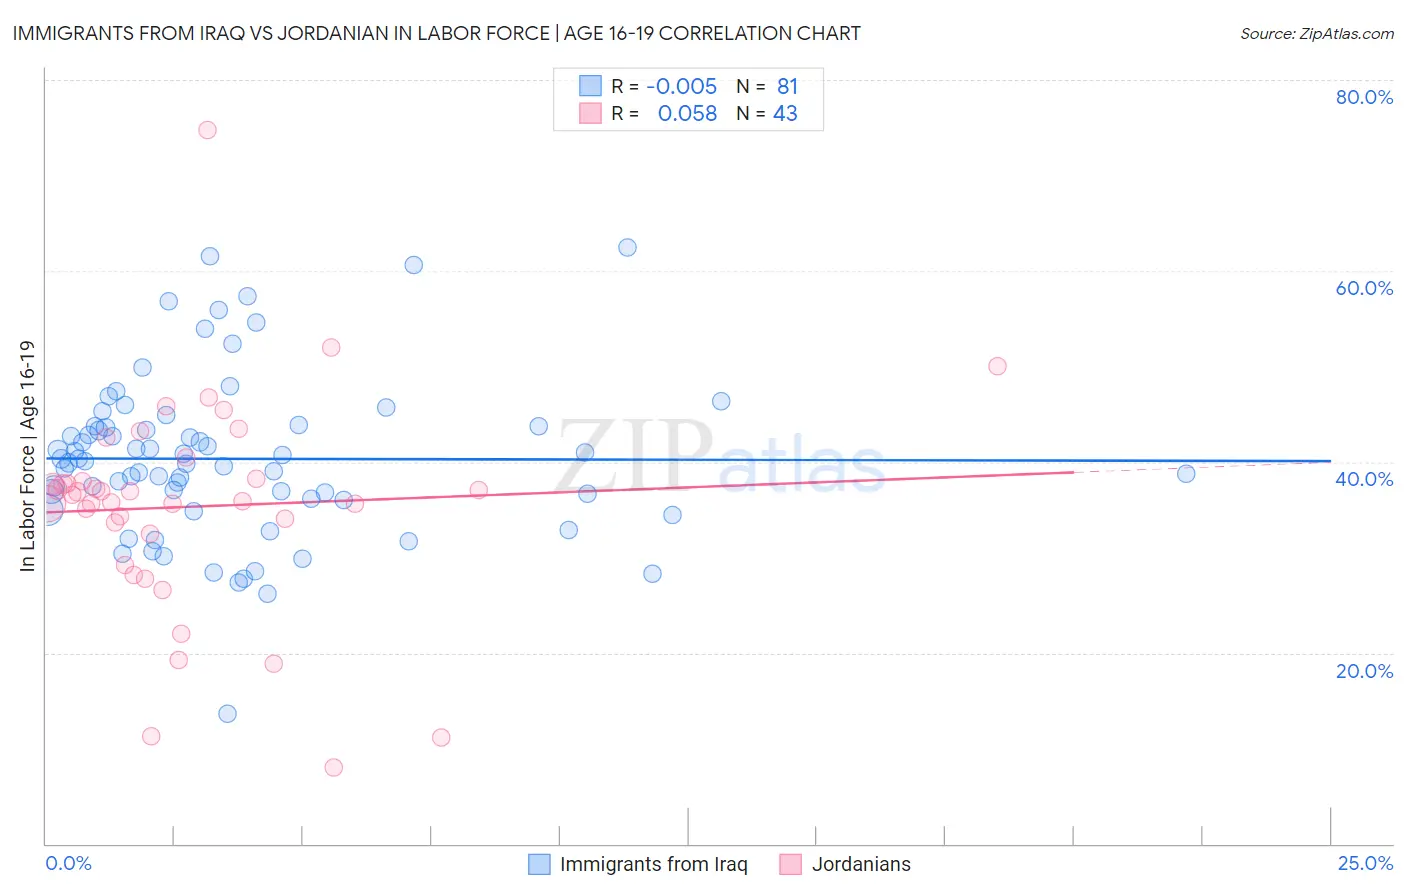
Immigrants from Iraq vs Jordanian In Labor Force | Age 16-19 Correlation Chart
The statistical analysis conducted on geographies consisting of 194,717,275 people shows no correlation between the proportion of Immigrants from Iraq and labor force participation rate among population between the ages 16 and 19 in the United States with a correlation coefficient (R) of -0.005 and weighted average of 39.4%. Similarly, the statistical analysis conducted on geographies consisting of 166,360,707 people shows a slight positive correlation between the proportion of Jordanians and labor force participation rate among population between the ages 16 and 19 in the United States with a correlation coefficient (R) of 0.058 and weighted average of 36.4%, a difference of 8.3%.
In Labor Force | Age 16-19 Correlation Summary
| Measurement | Immigrants from Iraq | Jordanian |
| Minimum | 13.6% | 8.0% |
| Maximum | 62.4% | 74.8% |
| Range | 48.8% | 66.8% |
| Mean | 40.3% | 35.3% |
| Median | 40.0% | 36.5% |
| Interquartile 25% (IQ1) | 36.1% | 32.5% |
| Interquartile 75% (IQ3) | 43.7% | 38.2% |
| Interquartile Range (IQR) | 7.6% | 5.7% |
| Standard Deviation (Sample) | 8.5% | 11.5% |
| Standard Deviation (Population) | 8.5% | 11.3% |
Similar Demographics by In Labor Force | Age 16-19
Demographics Similar to Immigrants from Iraq by In Labor Force | Age 16-19
In terms of in labor force | age 16-19, the demographic groups most similar to Immigrants from Iraq are Marshallese (39.5%, a difference of 0.18%), Shoshone (39.3%, a difference of 0.28%), Austrian (39.5%, a difference of 0.31%), Basque (39.3%, a difference of 0.34%), and Spanish (39.3%, a difference of 0.36%).
| Demographics | Rating | Rank | In Labor Force | Age 16-19 |
| Immigrants | Middle Africa | 99.9 /100 | #73 | Exceptional 39.9% |
| Hungarians | 99.9 /100 | #74 | Exceptional 39.8% |
| French American Indians | 99.9 /100 | #75 | Exceptional 39.8% |
| Malaysians | 99.9 /100 | #76 | Exceptional 39.7% |
| Immigrants | Portugal | 99.9 /100 | #77 | Exceptional 39.7% |
| Austrians | 99.8 /100 | #78 | Exceptional 39.5% |
| Marshallese | 99.8 /100 | #79 | Exceptional 39.5% |
| Immigrants | Iraq | 99.8 /100 | #80 | Exceptional 39.4% |
| Shoshone | 99.7 /100 | #81 | Exceptional 39.3% |
| Basques | 99.7 /100 | #82 | Exceptional 39.3% |
| Spanish | 99.7 /100 | #83 | Exceptional 39.3% |
| Immigrants | Uganda | 99.7 /100 | #84 | Exceptional 39.2% |
| Creek | 99.6 /100 | #85 | Exceptional 39.1% |
| Samoans | 99.6 /100 | #86 | Exceptional 39.1% |
| Immigrants | Germany | 99.6 /100 | #87 | Exceptional 39.1% |
Demographics Similar to Jordanians by In Labor Force | Age 16-19
In terms of in labor force | age 16-19, the demographic groups most similar to Jordanians are Immigrants from Italy (36.4%, a difference of 0.030%), Eastern European (36.4%, a difference of 0.040%), Immigrants from Morocco (36.4%, a difference of 0.080%), Costa Rican (36.3%, a difference of 0.19%), and Immigrants from Southern Europe (36.4%, a difference of 0.20%).
| Demographics | Rating | Rank | In Labor Force | Age 16-19 |
| Immigrants | Czechoslovakia | 50.0 /100 | #174 | Average 36.6% |
| Natives/Alaskans | 49.0 /100 | #175 | Average 36.6% |
| Albanians | 48.8 /100 | #176 | Average 36.5% |
| Immigrants | Northern Europe | 46.6 /100 | #177 | Average 36.5% |
| Blacks/African Americans | 45.1 /100 | #178 | Average 36.5% |
| Immigrants | Southern Europe | 43.3 /100 | #179 | Average 36.4% |
| Immigrants | Morocco | 41.1 /100 | #180 | Average 36.4% |
| Jordanians | 39.6 /100 | #181 | Fair 36.4% |
| Immigrants | Italy | 39.1 /100 | #182 | Fair 36.4% |
| Eastern Europeans | 38.8 /100 | #183 | Fair 36.4% |
| Costa Ricans | 36.1 /100 | #184 | Fair 36.3% |
| Bhutanese | 35.3 /100 | #185 | Fair 36.3% |
| Immigrants | Romania | 34.0 /100 | #186 | Fair 36.3% |
| Immigrants | Afghanistan | 34.0 /100 | #187 | Fair 36.3% |
| Immigrants | Europe | 31.8 /100 | #188 | Fair 36.2% |