Immigrants from Iraq vs Immigrants from Belarus In Labor Force | Age 16-19
COMPARE
Immigrants from Iraq
Immigrants from Belarus
In Labor Force | Age 16-19
In Labor Force | Age 16-19 Comparison
Immigrants from Iraq
Immigrants from Belarus
39.4%
IN LABOR FORCE | AGE 16-19
99.8/ 100
METRIC RATING
80th/ 347
METRIC RANK
33.4%
IN LABOR FORCE | AGE 16-19
0.1/ 100
METRIC RATING
291st/ 347
METRIC RANK
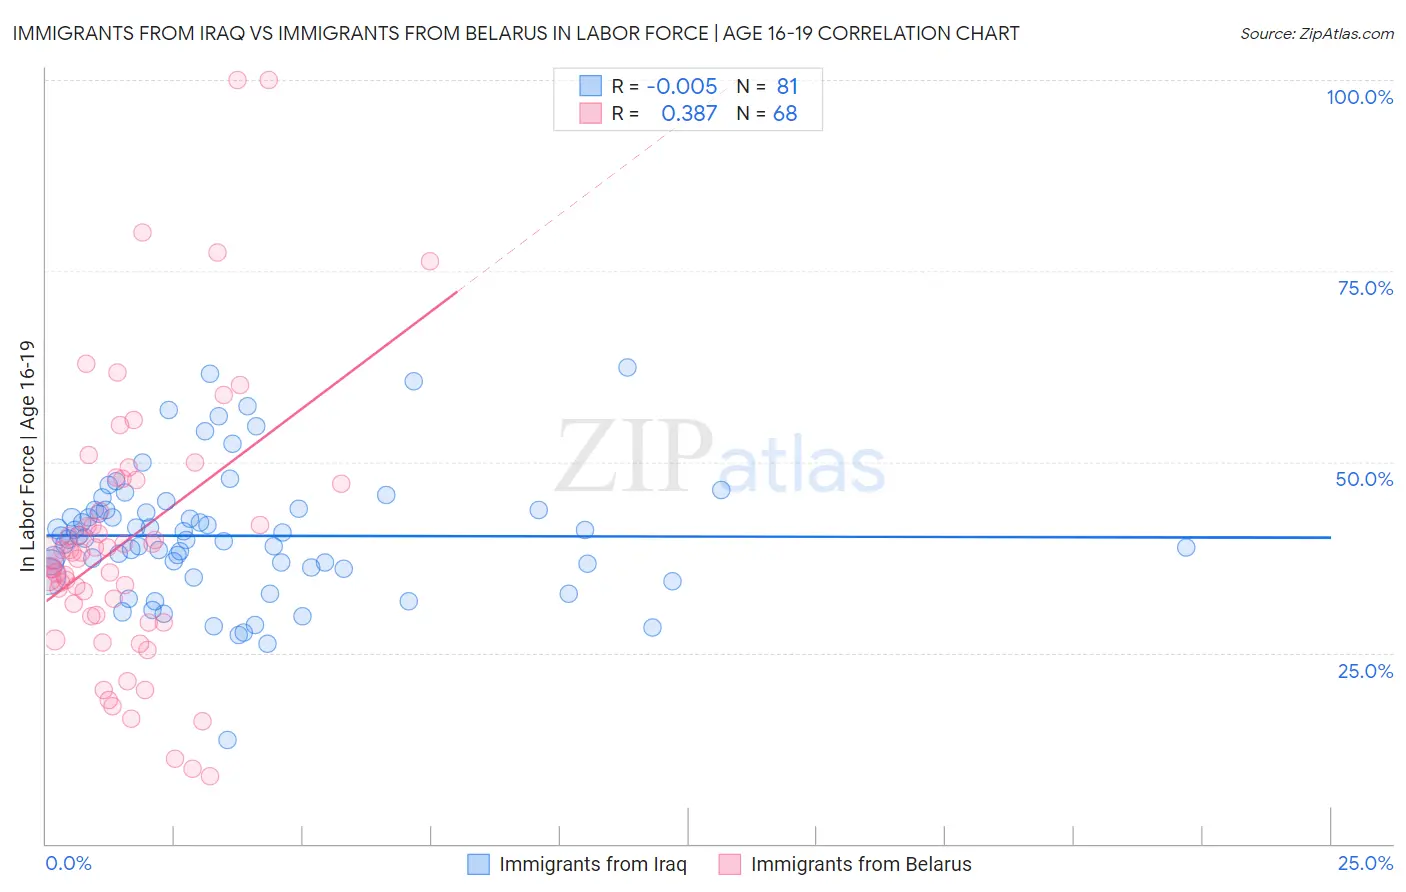
Immigrants from Iraq vs Immigrants from Belarus In Labor Force | Age 16-19 Correlation Chart
The statistical analysis conducted on geographies consisting of 194,717,275 people shows no correlation between the proportion of Immigrants from Iraq and labor force participation rate among population between the ages 16 and 19 in the United States with a correlation coefficient (R) of -0.005 and weighted average of 39.4%. Similarly, the statistical analysis conducted on geographies consisting of 150,086,766 people shows a mild positive correlation between the proportion of Immigrants from Belarus and labor force participation rate among population between the ages 16 and 19 in the United States with a correlation coefficient (R) of 0.387 and weighted average of 33.4%, a difference of 17.9%.
In Labor Force | Age 16-19 Correlation Summary
| Measurement | Immigrants from Iraq | Immigrants from Belarus |
| Minimum | 13.6% | 8.8% |
| Maximum | 62.4% | 100.0% |
| Range | 48.8% | 91.2% |
| Mean | 40.3% | 39.8% |
| Median | 40.0% | 38.0% |
| Interquartile 25% (IQ1) | 36.1% | 29.9% |
| Interquartile 75% (IQ3) | 43.7% | 47.4% |
| Interquartile Range (IQR) | 7.6% | 17.5% |
| Standard Deviation (Sample) | 8.5% | 18.1% |
| Standard Deviation (Population) | 8.5% | 17.9% |
Similar Demographics by In Labor Force | Age 16-19
Demographics Similar to Immigrants from Iraq by In Labor Force | Age 16-19
In terms of in labor force | age 16-19, the demographic groups most similar to Immigrants from Iraq are Marshallese (39.5%, a difference of 0.18%), Shoshone (39.3%, a difference of 0.28%), Austrian (39.5%, a difference of 0.31%), Basque (39.3%, a difference of 0.34%), and Spanish (39.3%, a difference of 0.36%).
| Demographics | Rating | Rank | In Labor Force | Age 16-19 |
| Immigrants | Middle Africa | 99.9 /100 | #73 | Exceptional 39.9% |
| Hungarians | 99.9 /100 | #74 | Exceptional 39.8% |
| French American Indians | 99.9 /100 | #75 | Exceptional 39.8% |
| Malaysians | 99.9 /100 | #76 | Exceptional 39.7% |
| Immigrants | Portugal | 99.9 /100 | #77 | Exceptional 39.7% |
| Austrians | 99.8 /100 | #78 | Exceptional 39.5% |
| Marshallese | 99.8 /100 | #79 | Exceptional 39.5% |
| Immigrants | Iraq | 99.8 /100 | #80 | Exceptional 39.4% |
| Shoshone | 99.7 /100 | #81 | Exceptional 39.3% |
| Basques | 99.7 /100 | #82 | Exceptional 39.3% |
| Spanish | 99.7 /100 | #83 | Exceptional 39.3% |
| Immigrants | Uganda | 99.7 /100 | #84 | Exceptional 39.2% |
| Creek | 99.6 /100 | #85 | Exceptional 39.1% |
| Samoans | 99.6 /100 | #86 | Exceptional 39.1% |
| Immigrants | Germany | 99.6 /100 | #87 | Exceptional 39.1% |
Demographics Similar to Immigrants from Belarus by In Labor Force | Age 16-19
In terms of in labor force | age 16-19, the demographic groups most similar to Immigrants from Belarus are Haitian (33.4%, a difference of 0.060%), Immigrants from Colombia (33.5%, a difference of 0.080%), Immigrants from Singapore (33.5%, a difference of 0.21%), Immigrants from Indonesia (33.5%, a difference of 0.22%), and Nepalese (33.5%, a difference of 0.25%).
| Demographics | Rating | Rank | In Labor Force | Age 16-19 |
| Immigrants | Spain | 0.2 /100 | #284 | Tragic 33.7% |
| U.S. Virgin Islanders | 0.2 /100 | #285 | Tragic 33.6% |
| South Americans | 0.2 /100 | #286 | Tragic 33.6% |
| Nepalese | 0.1 /100 | #287 | Tragic 33.5% |
| Immigrants | Indonesia | 0.1 /100 | #288 | Tragic 33.5% |
| Immigrants | Singapore | 0.1 /100 | #289 | Tragic 33.5% |
| Immigrants | Colombia | 0.1 /100 | #290 | Tragic 33.5% |
| Immigrants | Belarus | 0.1 /100 | #291 | Tragic 33.4% |
| Haitians | 0.1 /100 | #292 | Tragic 33.4% |
| Immigrants | South America | 0.1 /100 | #293 | Tragic 33.3% |
| Argentineans | 0.1 /100 | #294 | Tragic 33.3% |
| Yup'ik | 0.1 /100 | #295 | Tragic 33.3% |
| Jamaicans | 0.1 /100 | #296 | Tragic 33.2% |
| Immigrants | Haiti | 0.1 /100 | #297 | Tragic 33.2% |
| Iranians | 0.0 /100 | #298 | Tragic 33.0% |