Immigrants from Iraq vs Danish In Labor Force | Age 20-24
COMPARE
Immigrants from Iraq
Danish
In Labor Force | Age 20-24
In Labor Force | Age 20-24 Comparison
Immigrants from Iraq
Danes
76.4%
IN LABOR FORCE | AGE 20-24
99.3/ 100
METRIC RATING
86th/ 347
METRIC RANK
79.0%
IN LABOR FORCE | AGE 20-24
100.0/ 100
METRIC RATING
6th/ 347
METRIC RANK
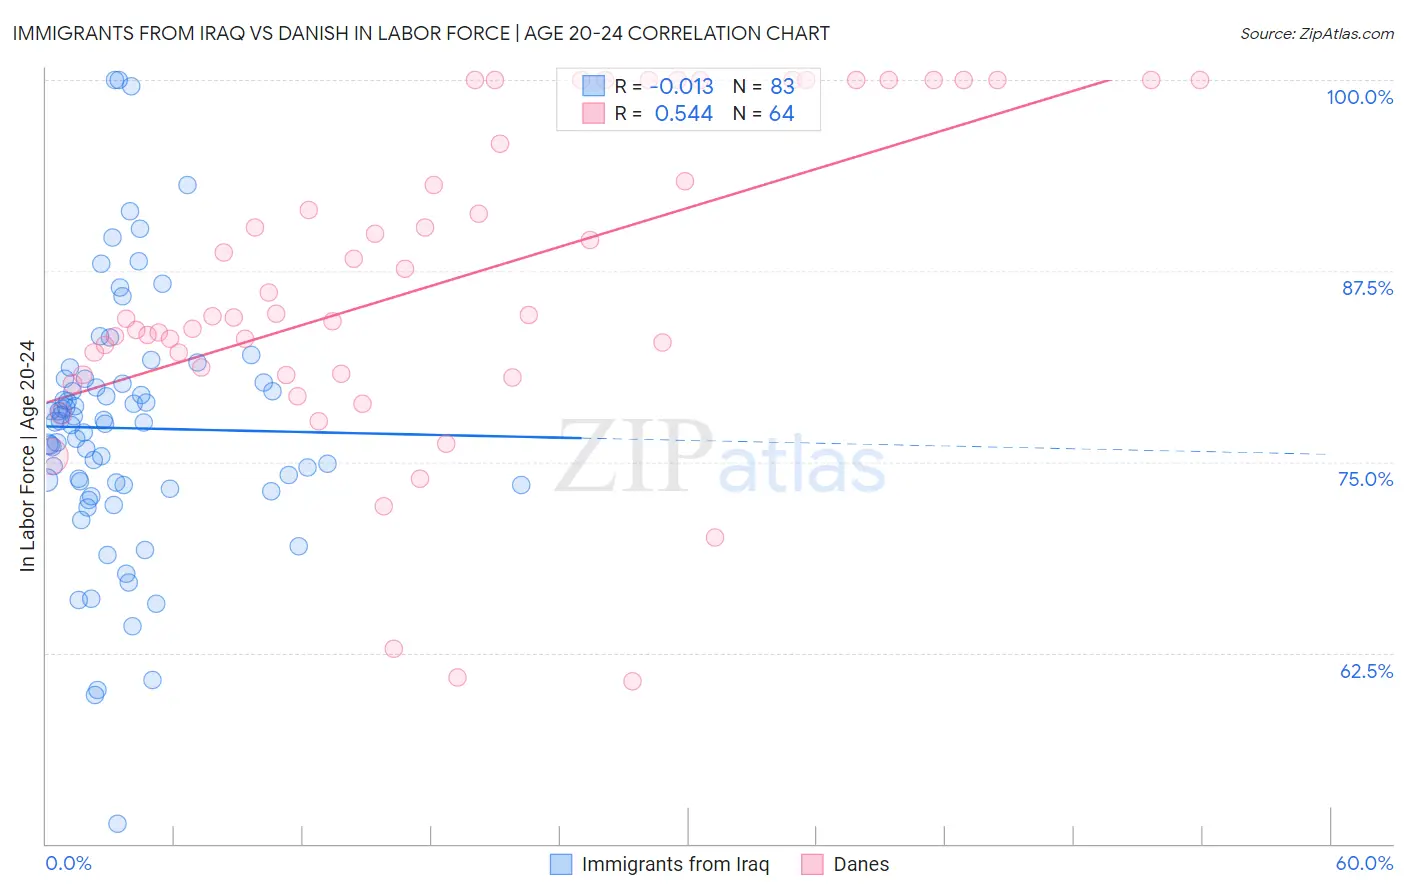
Immigrants from Iraq vs Danish In Labor Force | Age 20-24 Correlation Chart
The statistical analysis conducted on geographies consisting of 194,771,125 people shows no correlation between the proportion of Immigrants from Iraq and labor force participation rate among population between the ages 20 and 24 in the United States with a correlation coefficient (R) of -0.013 and weighted average of 76.4%. Similarly, the statistical analysis conducted on geographies consisting of 473,606,493 people shows a substantial positive correlation between the proportion of Danes and labor force participation rate among population between the ages 20 and 24 in the United States with a correlation coefficient (R) of 0.544 and weighted average of 79.0%, a difference of 3.4%.
In Labor Force | Age 20-24 Correlation Summary
| Measurement | Immigrants from Iraq | Danish |
| Minimum | 51.3% | 60.6% |
| Maximum | 100.0% | 100.0% |
| Range | 48.7% | 39.4% |
| Mean | 77.2% | 86.7% |
| Median | 77.5% | 84.5% |
| Interquartile 25% (IQ1) | 73.5% | 80.8% |
| Interquartile 75% (IQ3) | 80.2% | 97.9% |
| Interquartile Range (IQR) | 6.7% | 17.1% |
| Standard Deviation (Sample) | 8.4% | 10.2% |
| Standard Deviation (Population) | 8.4% | 10.1% |
Similar Demographics by In Labor Force | Age 20-24
Demographics Similar to Immigrants from Iraq by In Labor Force | Age 20-24
In terms of in labor force | age 20-24, the demographic groups most similar to Immigrants from Iraq are Immigrants from Thailand (76.4%, a difference of 0.0%), Portuguese (76.4%, a difference of 0.030%), Austrian (76.5%, a difference of 0.050%), Spanish (76.4%, a difference of 0.050%), and Carpatho Rusyn (76.5%, a difference of 0.060%).
| Demographics | Rating | Rank | In Labor Force | Age 20-24 |
| Immigrants | Zaire | 99.6 /100 | #79 | Exceptional 76.6% |
| Italians | 99.6 /100 | #80 | Exceptional 76.5% |
| Basques | 99.5 /100 | #81 | Exceptional 76.5% |
| Hmong | 99.5 /100 | #82 | Exceptional 76.5% |
| Carpatho Rusyns | 99.4 /100 | #83 | Exceptional 76.5% |
| Austrians | 99.4 /100 | #84 | Exceptional 76.5% |
| Portuguese | 99.3 /100 | #85 | Exceptional 76.4% |
| Immigrants | Iraq | 99.3 /100 | #86 | Exceptional 76.4% |
| Immigrants | Thailand | 99.3 /100 | #87 | Exceptional 76.4% |
| Spanish | 99.2 /100 | #88 | Exceptional 76.4% |
| Bulgarians | 99.2 /100 | #89 | Exceptional 76.4% |
| Immigrants | Burma/Myanmar | 99.1 /100 | #90 | Exceptional 76.3% |
| Sierra Leoneans | 99.0 /100 | #91 | Exceptional 76.3% |
| Maltese | 98.9 /100 | #92 | Exceptional 76.3% |
| Hungarians | 98.9 /100 | #93 | Exceptional 76.3% |
Demographics Similar to Danes by In Labor Force | Age 20-24
In terms of in labor force | age 20-24, the demographic groups most similar to Danes are Aleut (79.0%, a difference of 0.010%), Luxembourger (79.0%, a difference of 0.040%), Alaskan Athabascan (79.1%, a difference of 0.15%), Immigrants from Cabo Verde (78.9%, a difference of 0.15%), and Swedish (78.8%, a difference of 0.21%).
| Demographics | Rating | Rank | In Labor Force | Age 20-24 |
| Norwegians | 100.0 /100 | #1 | Exceptional 80.1% |
| Immigrants | Somalia | 100.0 /100 | #2 | Exceptional 79.5% |
| Somalis | 100.0 /100 | #3 | Exceptional 79.3% |
| Alaskan Athabascans | 100.0 /100 | #4 | Exceptional 79.1% |
| Aleuts | 100.0 /100 | #5 | Exceptional 79.0% |
| Danes | 100.0 /100 | #6 | Exceptional 79.0% |
| Luxembourgers | 100.0 /100 | #7 | Exceptional 79.0% |
| Immigrants | Cabo Verde | 100.0 /100 | #8 | Exceptional 78.9% |
| Swedes | 100.0 /100 | #9 | Exceptional 78.8% |
| Slovenes | 100.0 /100 | #10 | Exceptional 78.7% |
| Finns | 100.0 /100 | #11 | Exceptional 78.7% |
| Germans | 100.0 /100 | #12 | Exceptional 78.6% |
| Scandinavians | 100.0 /100 | #13 | Exceptional 78.5% |
| Czechs | 100.0 /100 | #14 | Exceptional 78.5% |
| Sudanese | 100.0 /100 | #15 | Exceptional 78.4% |