Immigrants from Iraq vs Cuban In Labor Force | Age 20-24
COMPARE
Immigrants from Iraq
Cuban
In Labor Force | Age 20-24
In Labor Force | Age 20-24 Comparison
Immigrants from Iraq
Cubans
76.4%
IN LABOR FORCE | AGE 20-24
99.3/ 100
METRIC RATING
86th/ 347
METRIC RANK
72.5%
IN LABOR FORCE | AGE 20-24
0.0/ 100
METRIC RATING
301st/ 347
METRIC RANK
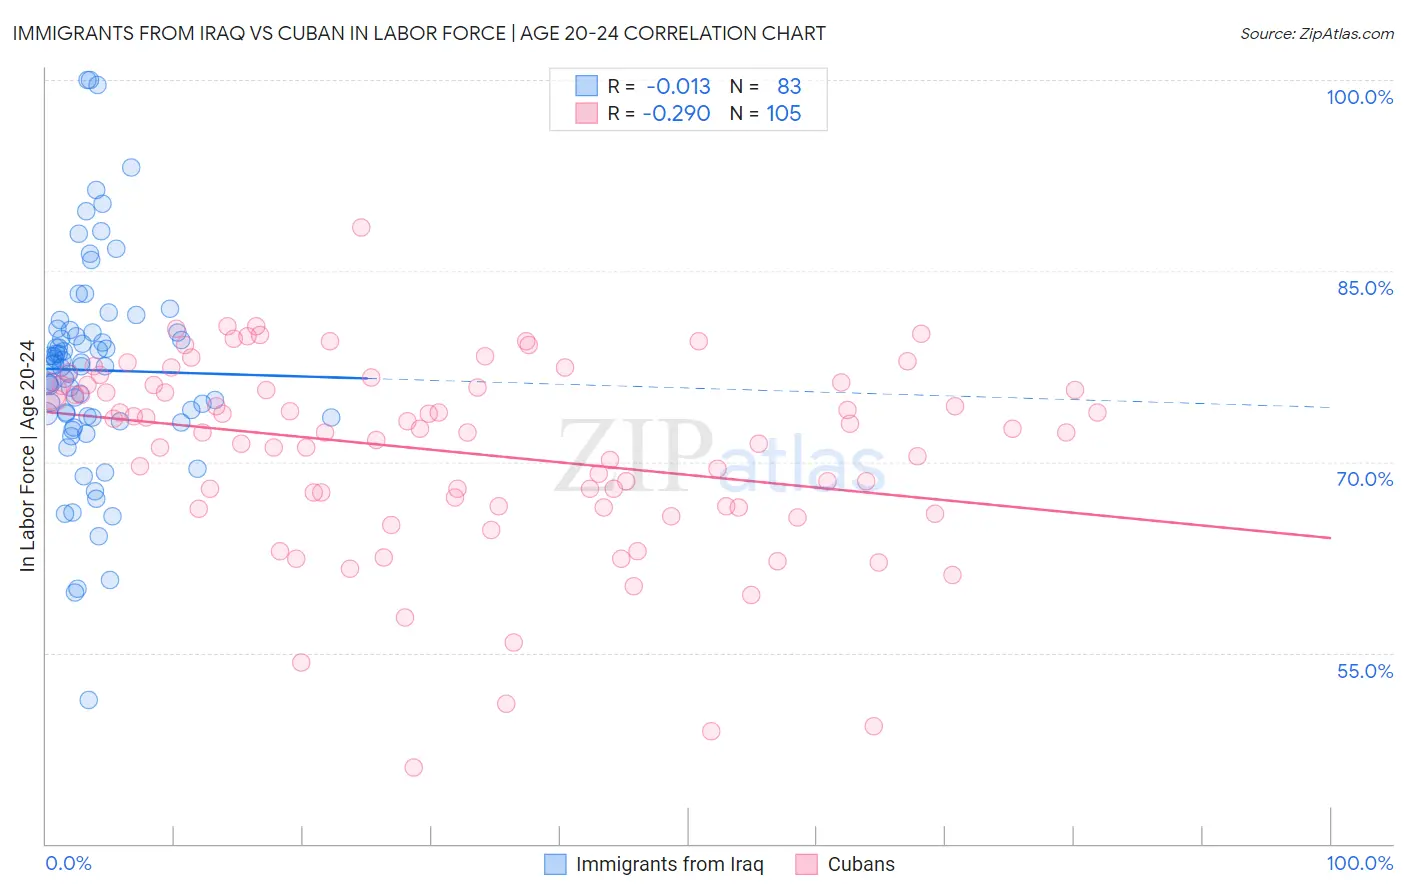
Immigrants from Iraq vs Cuban In Labor Force | Age 20-24 Correlation Chart
The statistical analysis conducted on geographies consisting of 194,771,125 people shows no correlation between the proportion of Immigrants from Iraq and labor force participation rate among population between the ages 20 and 24 in the United States with a correlation coefficient (R) of -0.013 and weighted average of 76.4%. Similarly, the statistical analysis conducted on geographies consisting of 449,113,848 people shows a weak negative correlation between the proportion of Cubans and labor force participation rate among population between the ages 20 and 24 in the United States with a correlation coefficient (R) of -0.290 and weighted average of 72.5%, a difference of 5.4%.
In Labor Force | Age 20-24 Correlation Summary
| Measurement | Immigrants from Iraq | Cuban |
| Minimum | 51.3% | 46.0% |
| Maximum | 100.0% | 88.4% |
| Range | 48.7% | 42.4% |
| Mean | 77.2% | 70.8% |
| Median | 77.5% | 72.4% |
| Interquartile 25% (IQ1) | 73.5% | 66.4% |
| Interquartile 75% (IQ3) | 80.2% | 76.0% |
| Interquartile Range (IQR) | 6.7% | 9.6% |
| Standard Deviation (Sample) | 8.4% | 7.6% |
| Standard Deviation (Population) | 8.4% | 7.6% |
Similar Demographics by In Labor Force | Age 20-24
Demographics Similar to Immigrants from Iraq by In Labor Force | Age 20-24
In terms of in labor force | age 20-24, the demographic groups most similar to Immigrants from Iraq are Immigrants from Thailand (76.4%, a difference of 0.0%), Portuguese (76.4%, a difference of 0.030%), Austrian (76.5%, a difference of 0.050%), Spanish (76.4%, a difference of 0.050%), and Carpatho Rusyn (76.5%, a difference of 0.060%).
| Demographics | Rating | Rank | In Labor Force | Age 20-24 |
| Immigrants | Zaire | 99.6 /100 | #79 | Exceptional 76.6% |
| Italians | 99.6 /100 | #80 | Exceptional 76.5% |
| Basques | 99.5 /100 | #81 | Exceptional 76.5% |
| Hmong | 99.5 /100 | #82 | Exceptional 76.5% |
| Carpatho Rusyns | 99.4 /100 | #83 | Exceptional 76.5% |
| Austrians | 99.4 /100 | #84 | Exceptional 76.5% |
| Portuguese | 99.3 /100 | #85 | Exceptional 76.4% |
| Immigrants | Iraq | 99.3 /100 | #86 | Exceptional 76.4% |
| Immigrants | Thailand | 99.3 /100 | #87 | Exceptional 76.4% |
| Spanish | 99.2 /100 | #88 | Exceptional 76.4% |
| Bulgarians | 99.2 /100 | #89 | Exceptional 76.4% |
| Immigrants | Burma/Myanmar | 99.1 /100 | #90 | Exceptional 76.3% |
| Sierra Leoneans | 99.0 /100 | #91 | Exceptional 76.3% |
| Maltese | 98.9 /100 | #92 | Exceptional 76.3% |
| Hungarians | 98.9 /100 | #93 | Exceptional 76.3% |
Demographics Similar to Cubans by In Labor Force | Age 20-24
In terms of in labor force | age 20-24, the demographic groups most similar to Cubans are Armenian (72.5%, a difference of 0.070%), Iranian (72.6%, a difference of 0.090%), Native/Alaskan (72.4%, a difference of 0.090%), Ecuadorian (72.4%, a difference of 0.10%), and Immigrants from West Indies (72.4%, a difference of 0.11%).
| Demographics | Rating | Rank | In Labor Force | Age 20-24 |
| Immigrants | Argentina | 0.0 /100 | #294 | Tragic 72.8% |
| Okinawans | 0.0 /100 | #295 | Tragic 72.7% |
| Jamaicans | 0.0 /100 | #296 | Tragic 72.7% |
| Central American Indians | 0.0 /100 | #297 | Tragic 72.7% |
| Israelis | 0.0 /100 | #298 | Tragic 72.6% |
| Iranians | 0.0 /100 | #299 | Tragic 72.6% |
| Armenians | 0.0 /100 | #300 | Tragic 72.5% |
| Cubans | 0.0 /100 | #301 | Tragic 72.5% |
| Natives/Alaskans | 0.0 /100 | #302 | Tragic 72.4% |
| Ecuadorians | 0.0 /100 | #303 | Tragic 72.4% |
| Immigrants | West Indies | 0.0 /100 | #304 | Tragic 72.4% |
| Immigrants | Singapore | 0.0 /100 | #305 | Tragic 72.4% |
| Immigrants | Jamaica | 0.0 /100 | #306 | Tragic 72.4% |
| Immigrants | Ecuador | 0.0 /100 | #307 | Tragic 72.3% |
| Soviet Union | 0.0 /100 | #308 | Tragic 72.3% |