Immigrants from Ghana vs Nepalese In Labor Force | Age 20-64
COMPARE
Immigrants from Ghana
Nepalese
In Labor Force | Age 20-64
In Labor Force | Age 20-64 Comparison
Immigrants from Ghana
Nepalese
80.0%
IN LABOR FORCE | AGE 20-64
95.0/ 100
METRIC RATING
105th/ 347
METRIC RANK
77.5%
IN LABOR FORCE | AGE 20-64
0.0/ 100
METRIC RATING
301st/ 347
METRIC RANK
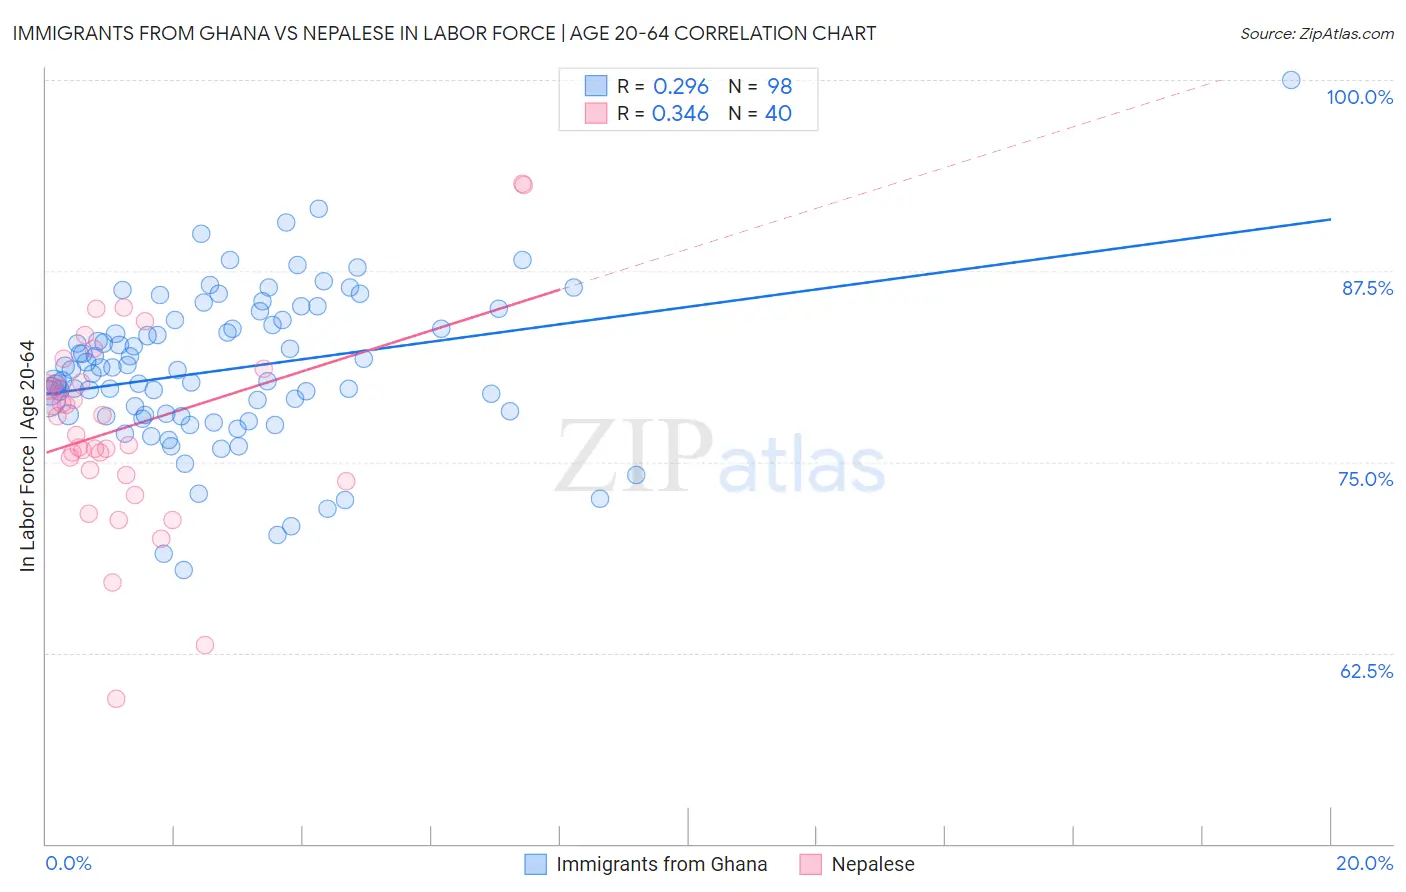
Immigrants from Ghana vs Nepalese In Labor Force | Age 20-64 Correlation Chart
The statistical analysis conducted on geographies consisting of 199,964,545 people shows a weak positive correlation between the proportion of Immigrants from Ghana and labor force participation rate among population between the ages 20 and 64 in the United States with a correlation coefficient (R) of 0.296 and weighted average of 80.0%. Similarly, the statistical analysis conducted on geographies consisting of 24,521,755 people shows a mild positive correlation between the proportion of Nepalese and labor force participation rate among population between the ages 20 and 64 in the United States with a correlation coefficient (R) of 0.346 and weighted average of 77.5%, a difference of 3.2%.
In Labor Force | Age 20-64 Correlation Summary
| Measurement | Immigrants from Ghana | Nepalese |
| Minimum | 67.9% | 59.5% |
| Maximum | 100.0% | 93.2% |
| Range | 32.1% | 33.7% |
| Mean | 81.1% | 77.3% |
| Median | 81.0% | 77.4% |
| Interquartile 25% (IQ1) | 78.0% | 74.3% |
| Interquartile 75% (IQ3) | 84.3% | 80.2% |
| Interquartile Range (IQR) | 6.3% | 5.9% |
| Standard Deviation (Sample) | 5.1% | 6.5% |
| Standard Deviation (Population) | 5.0% | 6.5% |
Similar Demographics by In Labor Force | Age 20-64
Demographics Similar to Immigrants from Ghana by In Labor Force | Age 20-64
In terms of in labor force | age 20-64, the demographic groups most similar to Immigrants from Ghana are Venezuelan (80.0%, a difference of 0.010%), Greek (80.0%, a difference of 0.010%), Immigrants from Jordan (80.0%, a difference of 0.010%), Palestinian (80.0%, a difference of 0.020%), and Immigrants from Australia (80.0%, a difference of 0.020%).
| Demographics | Rating | Rank | In Labor Force | Age 20-64 |
| Immigrants | Uruguay | 95.8 /100 | #98 | Exceptional 80.1% |
| Immigrants | Chile | 95.7 /100 | #99 | Exceptional 80.1% |
| Filipinos | 95.6 /100 | #100 | Exceptional 80.1% |
| Palestinians | 95.5 /100 | #101 | Exceptional 80.0% |
| Immigrants | Australia | 95.5 /100 | #102 | Exceptional 80.0% |
| Russians | 95.5 /100 | #103 | Exceptional 80.0% |
| Venezuelans | 95.3 /100 | #104 | Exceptional 80.0% |
| Immigrants | Ghana | 95.0 /100 | #105 | Exceptional 80.0% |
| Greeks | 94.8 /100 | #106 | Exceptional 80.0% |
| Immigrants | Jordan | 94.8 /100 | #107 | Exceptional 80.0% |
| Iranians | 94.3 /100 | #108 | Exceptional 80.0% |
| Immigrants | Argentina | 94.1 /100 | #109 | Exceptional 80.0% |
| Estonians | 94.0 /100 | #110 | Exceptional 80.0% |
| Immigrants | South America | 93.9 /100 | #111 | Exceptional 80.0% |
| Immigrants | Italy | 93.9 /100 | #112 | Exceptional 80.0% |
Demographics Similar to Nepalese by In Labor Force | Age 20-64
In terms of in labor force | age 20-64, the demographic groups most similar to Nepalese are Spanish American Indian (77.6%, a difference of 0.040%), Iroquois (77.5%, a difference of 0.050%), Hispanic or Latino (77.6%, a difference of 0.11%), Cree (77.7%, a difference of 0.17%), and Immigrants from Dominican Republic (77.7%, a difference of 0.18%).
| Demographics | Rating | Rank | In Labor Force | Age 20-64 |
| Immigrants | Central America | 0.0 /100 | #294 | Tragic 77.7% |
| Immigrants | Grenada | 0.0 /100 | #295 | Tragic 77.7% |
| Immigrants | Dominican Republic | 0.0 /100 | #296 | Tragic 77.7% |
| Dominicans | 0.0 /100 | #297 | Tragic 77.7% |
| Cree | 0.0 /100 | #298 | Tragic 77.7% |
| Hispanics or Latinos | 0.0 /100 | #299 | Tragic 77.6% |
| Spanish American Indians | 0.0 /100 | #300 | Tragic 77.6% |
| Nepalese | 0.0 /100 | #301 | Tragic 77.5% |
| Iroquois | 0.0 /100 | #302 | Tragic 77.5% |
| Chippewa | 0.0 /100 | #303 | Tragic 77.3% |
| Immigrants | Mexico | 0.0 /100 | #304 | Tragic 77.3% |
| Mexicans | 0.0 /100 | #305 | Tragic 77.2% |
| Potawatomi | 0.0 /100 | #306 | Tragic 77.2% |
| Central American Indians | 0.0 /100 | #307 | Tragic 77.1% |
| Alaska Natives | 0.0 /100 | #308 | Tragic 77.0% |