Czech vs Nepalese In Labor Force | Age 20-64
COMPARE
Czech
Nepalese
In Labor Force | Age 20-64
In Labor Force | Age 20-64 Comparison
Czechs
Nepalese
80.5%
IN LABOR FORCE | AGE 20-64
99.7/ 100
METRIC RATING
43rd/ 347
METRIC RANK
77.5%
IN LABOR FORCE | AGE 20-64
0.0/ 100
METRIC RATING
301st/ 347
METRIC RANK
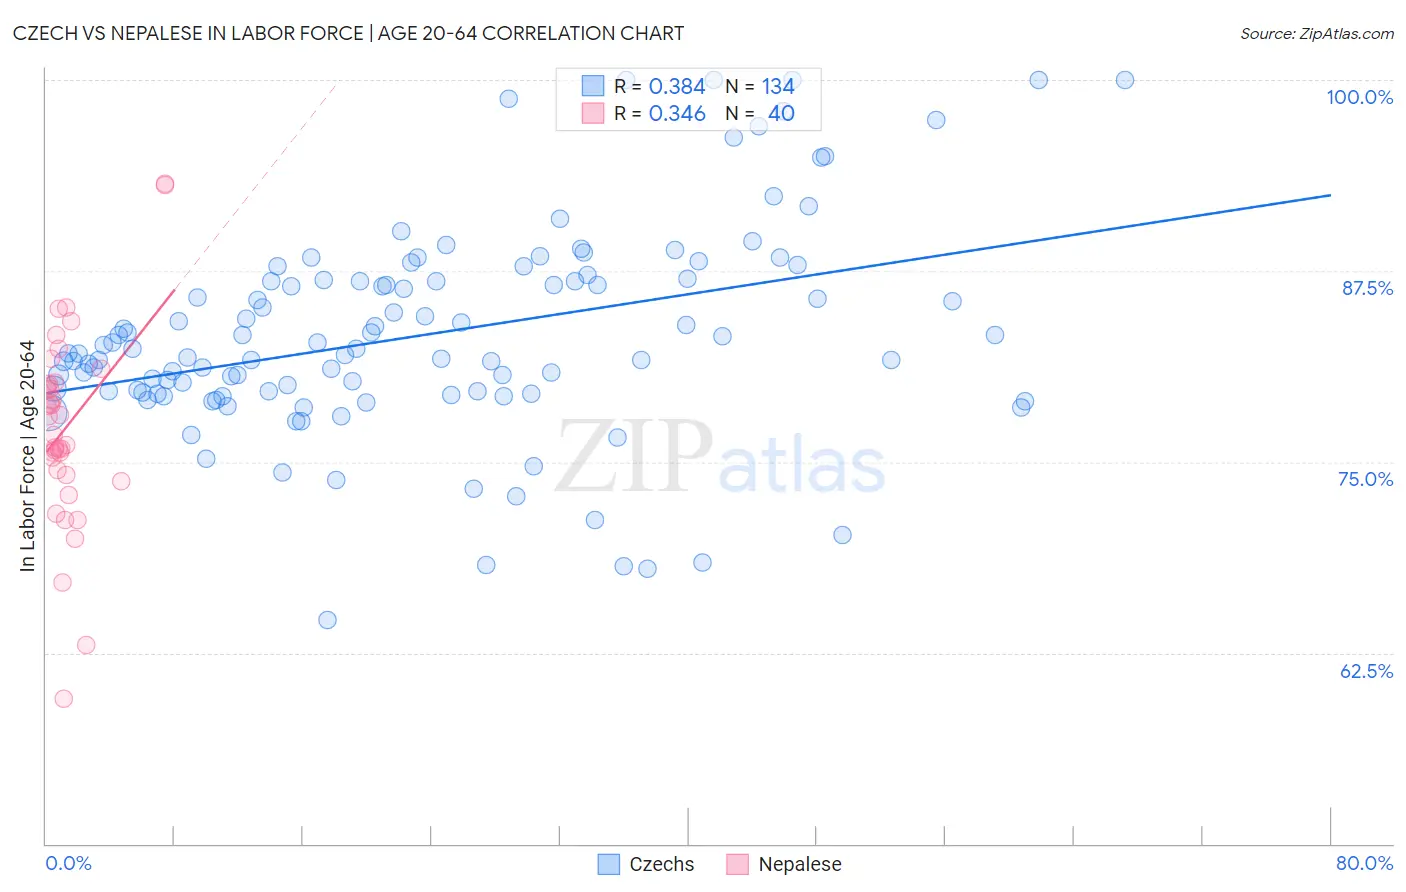
Czech vs Nepalese In Labor Force | Age 20-64 Correlation Chart
The statistical analysis conducted on geographies consisting of 484,822,871 people shows a mild positive correlation between the proportion of Czechs and labor force participation rate among population between the ages 20 and 64 in the United States with a correlation coefficient (R) of 0.384 and weighted average of 80.5%. Similarly, the statistical analysis conducted on geographies consisting of 24,521,755 people shows a mild positive correlation between the proportion of Nepalese and labor force participation rate among population between the ages 20 and 64 in the United States with a correlation coefficient (R) of 0.346 and weighted average of 77.5%, a difference of 3.9%.
In Labor Force | Age 20-64 Correlation Summary
| Measurement | Czech | Nepalese |
| Minimum | 64.6% | 59.5% |
| Maximum | 100.0% | 93.2% |
| Range | 35.4% | 33.7% |
| Mean | 83.3% | 77.3% |
| Median | 82.3% | 77.4% |
| Interquartile 25% (IQ1) | 79.6% | 74.3% |
| Interquartile 75% (IQ3) | 86.8% | 80.2% |
| Interquartile Range (IQR) | 7.3% | 5.9% |
| Standard Deviation (Sample) | 6.9% | 6.5% |
| Standard Deviation (Population) | 6.8% | 6.5% |
Similar Demographics by In Labor Force | Age 20-64
Demographics Similar to Czechs by In Labor Force | Age 20-64
In terms of in labor force | age 20-64, the demographic groups most similar to Czechs are Latvian (80.5%, a difference of 0.010%), Immigrants from Liberia (80.5%, a difference of 0.030%), Immigrants from Middle Africa (80.5%, a difference of 0.030%), Brazilian (80.5%, a difference of 0.040%), and Immigrants from Zimbabwe (80.5%, a difference of 0.040%).
| Demographics | Rating | Rank | In Labor Force | Age 20-64 |
| Paraguayans | 99.8 /100 | #36 | Exceptional 80.6% |
| Immigrants | Moldova | 99.8 /100 | #37 | Exceptional 80.6% |
| Ugandans | 99.8 /100 | #38 | Exceptional 80.6% |
| Brazilians | 99.8 /100 | #39 | Exceptional 80.5% |
| Immigrants | Zimbabwe | 99.8 /100 | #40 | Exceptional 80.5% |
| Immigrants | Liberia | 99.8 /100 | #41 | Exceptional 80.5% |
| Latvians | 99.8 /100 | #42 | Exceptional 80.5% |
| Czechs | 99.7 /100 | #43 | Exceptional 80.5% |
| Immigrants | Middle Africa | 99.7 /100 | #44 | Exceptional 80.5% |
| Slovenes | 99.7 /100 | #45 | Exceptional 80.5% |
| Immigrants | Pakistan | 99.6 /100 | #46 | Exceptional 80.5% |
| Immigrants | Africa | 99.6 /100 | #47 | Exceptional 80.4% |
| Immigrants | Hong Kong | 99.5 /100 | #48 | Exceptional 80.4% |
| Immigrants | Greece | 99.4 /100 | #49 | Exceptional 80.4% |
| Immigrants | Sudan | 99.4 /100 | #50 | Exceptional 80.4% |
Demographics Similar to Nepalese by In Labor Force | Age 20-64
In terms of in labor force | age 20-64, the demographic groups most similar to Nepalese are Spanish American Indian (77.6%, a difference of 0.040%), Iroquois (77.5%, a difference of 0.050%), Hispanic or Latino (77.6%, a difference of 0.11%), Cree (77.7%, a difference of 0.17%), and Immigrants from Dominican Republic (77.7%, a difference of 0.18%).
| Demographics | Rating | Rank | In Labor Force | Age 20-64 |
| Immigrants | Central America | 0.0 /100 | #294 | Tragic 77.7% |
| Immigrants | Grenada | 0.0 /100 | #295 | Tragic 77.7% |
| Immigrants | Dominican Republic | 0.0 /100 | #296 | Tragic 77.7% |
| Dominicans | 0.0 /100 | #297 | Tragic 77.7% |
| Cree | 0.0 /100 | #298 | Tragic 77.7% |
| Hispanics or Latinos | 0.0 /100 | #299 | Tragic 77.6% |
| Spanish American Indians | 0.0 /100 | #300 | Tragic 77.6% |
| Nepalese | 0.0 /100 | #301 | Tragic 77.5% |
| Iroquois | 0.0 /100 | #302 | Tragic 77.5% |
| Chippewa | 0.0 /100 | #303 | Tragic 77.3% |
| Immigrants | Mexico | 0.0 /100 | #304 | Tragic 77.3% |
| Mexicans | 0.0 /100 | #305 | Tragic 77.2% |
| Potawatomi | 0.0 /100 | #306 | Tragic 77.2% |
| Central American Indians | 0.0 /100 | #307 | Tragic 77.1% |
| Alaska Natives | 0.0 /100 | #308 | Tragic 77.0% |