Immigrants from Ethiopia vs Immigrants from Lebanon In Labor Force | Age 20-24
COMPARE
Immigrants from Ethiopia
Immigrants from Lebanon
In Labor Force | Age 20-24
In Labor Force | Age 20-24 Comparison
Immigrants from Ethiopia
Immigrants from Lebanon
77.5%
IN LABOR FORCE | AGE 20-24
100.0/ 100
METRIC RATING
33rd/ 347
METRIC RANK
73.1%
IN LABOR FORCE | AGE 20-24
0.1/ 100
METRIC RATING
286th/ 347
METRIC RANK
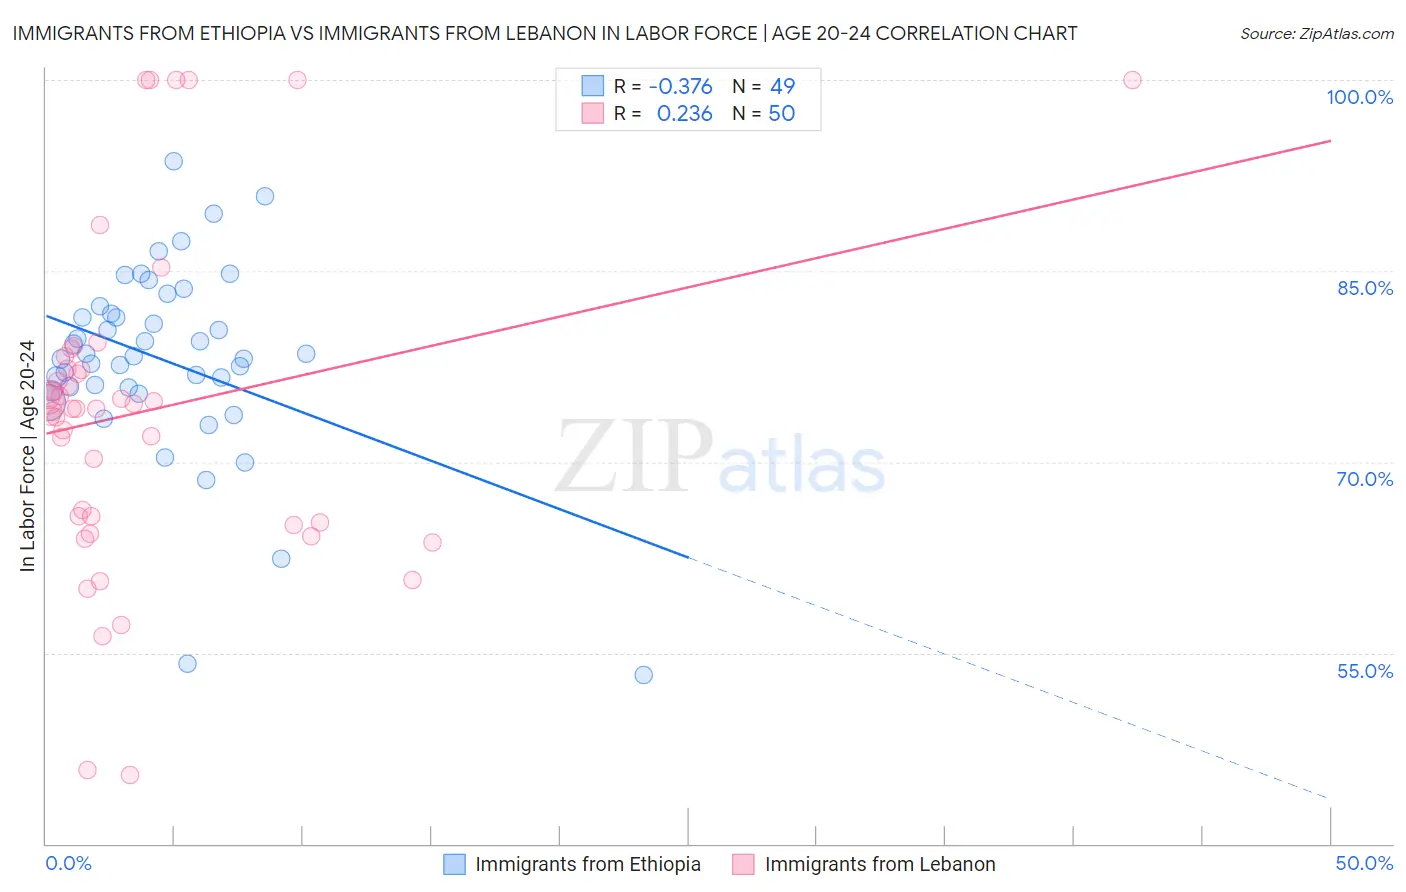
Immigrants from Ethiopia vs Immigrants from Lebanon In Labor Force | Age 20-24 Correlation Chart
The statistical analysis conducted on geographies consisting of 211,552,880 people shows a mild negative correlation between the proportion of Immigrants from Ethiopia and labor force participation rate among population between the ages 20 and 24 in the United States with a correlation coefficient (R) of -0.376 and weighted average of 77.5%. Similarly, the statistical analysis conducted on geographies consisting of 217,133,124 people shows a weak positive correlation between the proportion of Immigrants from Lebanon and labor force participation rate among population between the ages 20 and 24 in the United States with a correlation coefficient (R) of 0.236 and weighted average of 73.1%, a difference of 6.0%.
In Labor Force | Age 20-24 Correlation Summary
| Measurement | Immigrants from Ethiopia | Immigrants from Lebanon |
| Minimum | 53.3% | 45.4% |
| Maximum | 93.6% | 100.0% |
| Range | 40.3% | 54.6% |
| Mean | 78.0% | 74.0% |
| Median | 78.3% | 74.2% |
| Interquartile 25% (IQ1) | 75.7% | 65.2% |
| Interquartile 75% (IQ3) | 81.9% | 77.3% |
| Interquartile Range (IQR) | 6.2% | 12.1% |
| Standard Deviation (Sample) | 7.6% | 12.8% |
| Standard Deviation (Population) | 7.5% | 12.7% |
Similar Demographics by In Labor Force | Age 20-24
Demographics Similar to Immigrants from Ethiopia by In Labor Force | Age 20-24
In terms of in labor force | age 20-24, the demographic groups most similar to Immigrants from Ethiopia are German Russian (77.5%, a difference of 0.010%), Immigrants from Eastern Africa (77.5%, a difference of 0.020%), Welsh (77.5%, a difference of 0.040%), English (77.6%, a difference of 0.050%), and Czechoslovakian (77.5%, a difference of 0.050%).
| Demographics | Rating | Rank | In Labor Force | Age 20-24 |
| Tongans | 100.0 /100 | #26 | Exceptional 77.9% |
| Immigrants | Micronesia | 100.0 /100 | #27 | Exceptional 77.8% |
| Belgians | 100.0 /100 | #28 | Exceptional 77.8% |
| Slovaks | 100.0 /100 | #29 | Exceptional 77.7% |
| Swiss | 100.0 /100 | #30 | Exceptional 77.7% |
| Poles | 100.0 /100 | #31 | Exceptional 77.6% |
| English | 100.0 /100 | #32 | Exceptional 77.6% |
| Immigrants | Ethiopia | 100.0 /100 | #33 | Exceptional 77.5% |
| German Russians | 100.0 /100 | #34 | Exceptional 77.5% |
| Immigrants | Eastern Africa | 100.0 /100 | #35 | Exceptional 77.5% |
| Welsh | 100.0 /100 | #36 | Exceptional 77.5% |
| Czechoslovakians | 100.0 /100 | #37 | Exceptional 77.5% |
| Marshallese | 100.0 /100 | #38 | Exceptional 77.4% |
| Irish | 100.0 /100 | #39 | Exceptional 77.4% |
| Scottish | 100.0 /100 | #40 | Exceptional 77.4% |
Demographics Similar to Immigrants from Lebanon by In Labor Force | Age 20-24
In terms of in labor force | age 20-24, the demographic groups most similar to Immigrants from Lebanon are Immigrants from Korea (73.1%, a difference of 0.020%), Nicaraguan (73.2%, a difference of 0.030%), Kiowa (73.2%, a difference of 0.090%), Argentinean (73.1%, a difference of 0.10%), and Immigrants from Bahamas (73.2%, a difference of 0.11%).
| Demographics | Rating | Rank | In Labor Force | Age 20-24 |
| Venezuelans | 0.2 /100 | #279 | Tragic 73.3% |
| Bahamians | 0.1 /100 | #280 | Tragic 73.3% |
| Immigrants | Venezuela | 0.1 /100 | #281 | Tragic 73.2% |
| Immigrants | Spain | 0.1 /100 | #282 | Tragic 73.2% |
| Immigrants | Bahamas | 0.1 /100 | #283 | Tragic 73.2% |
| Kiowa | 0.1 /100 | #284 | Tragic 73.2% |
| Nicaraguans | 0.1 /100 | #285 | Tragic 73.2% |
| Immigrants | Lebanon | 0.1 /100 | #286 | Tragic 73.1% |
| Immigrants | Korea | 0.1 /100 | #287 | Tragic 73.1% |
| Argentineans | 0.1 /100 | #288 | Tragic 73.1% |
| U.S. Virgin Islanders | 0.1 /100 | #289 | Tragic 73.0% |
| Immigrants | Belarus | 0.1 /100 | #290 | Tragic 73.0% |
| Immigrants | Nicaragua | 0.0 /100 | #291 | Tragic 72.9% |
| Pueblo | 0.0 /100 | #292 | Tragic 72.9% |
| Immigrants | Belize | 0.0 /100 | #293 | Tragic 72.8% |