Immigrants from Ethiopia vs Immigrants from Lebanon Disability Age Over 75
COMPARE
Immigrants from Ethiopia
Immigrants from Lebanon
Disability Age Over 75
Disability Age Over 75 Comparison
Immigrants from Ethiopia
Immigrants from Lebanon
46.8%
DISABILITY AGE OVER 75
89.1/ 100
METRIC RATING
134th/ 347
METRIC RANK
47.6%
DISABILITY AGE OVER 75
26.5/ 100
METRIC RATING
194th/ 347
METRIC RANK
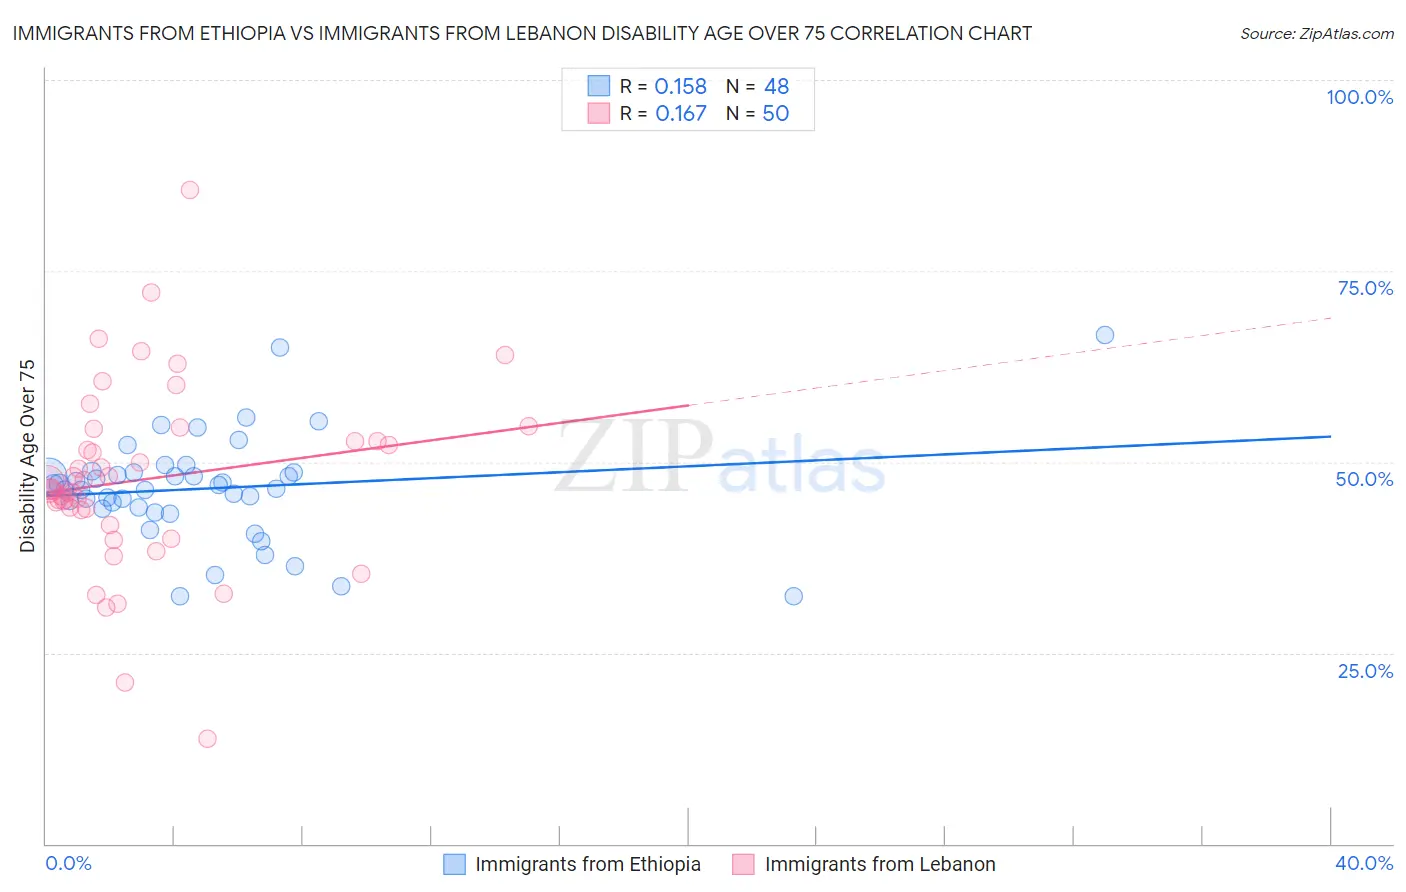
Immigrants from Ethiopia vs Immigrants from Lebanon Disability Age Over 75 Correlation Chart
The statistical analysis conducted on geographies consisting of 211,333,041 people shows a poor positive correlation between the proportion of Immigrants from Ethiopia and percentage of population with a disability over the age of 75 in the United States with a correlation coefficient (R) of 0.158 and weighted average of 46.8%. Similarly, the statistical analysis conducted on geographies consisting of 217,096,907 people shows a poor positive correlation between the proportion of Immigrants from Lebanon and percentage of population with a disability over the age of 75 in the United States with a correlation coefficient (R) of 0.167 and weighted average of 47.6%, a difference of 1.8%.
Disability Age Over 75 Correlation Summary
| Measurement | Immigrants from Ethiopia | Immigrants from Lebanon |
| Minimum | 32.4% | 13.8% |
| Maximum | 66.7% | 85.5% |
| Range | 34.3% | 71.8% |
| Mean | 46.5% | 47.7% |
| Median | 46.7% | 46.4% |
| Interquartile 25% (IQ1) | 43.9% | 43.7% |
| Interquartile 75% (IQ3) | 48.6% | 52.7% |
| Interquartile Range (IQR) | 4.7% | 9.1% |
| Standard Deviation (Sample) | 6.8% | 12.2% |
| Standard Deviation (Population) | 6.8% | 12.1% |
Similar Demographics by Disability Age Over 75
Demographics Similar to Immigrants from Ethiopia by Disability Age Over 75
In terms of disability age over 75, the demographic groups most similar to Immigrants from Ethiopia are Ethiopian (46.8%, a difference of 0.010%), English (46.8%, a difference of 0.020%), Immigrants from Venezuela (46.8%, a difference of 0.030%), Immigrants from Uganda (46.8%, a difference of 0.030%), and Immigrants from Bosnia and Herzegovina (46.8%, a difference of 0.040%).
| Demographics | Rating | Rank | Disability Age Over 75 |
| Syrians | 91.1 /100 | #127 | Exceptional 46.7% |
| Icelanders | 90.9 /100 | #128 | Exceptional 46.7% |
| Immigrants | Germany | 90.8 /100 | #129 | Exceptional 46.7% |
| Immigrants | Northern Africa | 90.7 /100 | #130 | Exceptional 46.7% |
| Scottish | 90.5 /100 | #131 | Exceptional 46.7% |
| South Americans | 90.0 /100 | #132 | Excellent 46.8% |
| English | 89.4 /100 | #133 | Excellent 46.8% |
| Immigrants | Ethiopia | 89.1 /100 | #134 | Excellent 46.8% |
| Ethiopians | 88.9 /100 | #135 | Excellent 46.8% |
| Immigrants | Venezuela | 88.6 /100 | #136 | Excellent 46.8% |
| Immigrants | Uganda | 88.5 /100 | #137 | Excellent 46.8% |
| Immigrants | Bosnia and Herzegovina | 88.5 /100 | #138 | Excellent 46.8% |
| Yugoslavians | 88.5 /100 | #139 | Excellent 46.8% |
| Immigrants | Costa Rica | 87.4 /100 | #140 | Excellent 46.8% |
| Lebanese | 87.0 /100 | #141 | Excellent 46.8% |
Demographics Similar to Immigrants from Lebanon by Disability Age Over 75
In terms of disability age over 75, the demographic groups most similar to Immigrants from Lebanon are Immigrants from Trinidad and Tobago (47.6%, a difference of 0.030%), Immigrants from Jamaica (47.6%, a difference of 0.050%), Ottawa (47.6%, a difference of 0.050%), Somali (47.6%, a difference of 0.080%), and Portuguese (47.6%, a difference of 0.080%).
| Demographics | Rating | Rank | Disability Age Over 75 |
| Immigrants | Sudan | 31.8 /100 | #187 | Fair 47.5% |
| Basques | 30.9 /100 | #188 | Fair 47.6% |
| Immigrants | Kenya | 30.8 /100 | #189 | Fair 47.6% |
| Somalis | 29.5 /100 | #190 | Fair 47.6% |
| Portuguese | 29.3 /100 | #191 | Fair 47.6% |
| Immigrants | Jamaica | 28.3 /100 | #192 | Fair 47.6% |
| Ottawa | 28.1 /100 | #193 | Fair 47.6% |
| Immigrants | Lebanon | 26.5 /100 | #194 | Fair 47.6% |
| Immigrants | Trinidad and Tobago | 25.3 /100 | #195 | Fair 47.6% |
| Immigrants | Portugal | 23.8 /100 | #196 | Fair 47.6% |
| Pakistanis | 23.4 /100 | #197 | Fair 47.7% |
| Immigrants | Ukraine | 23.2 /100 | #198 | Fair 47.7% |
| Immigrants | Eritrea | 22.4 /100 | #199 | Fair 47.7% |
| Immigrants | Somalia | 21.4 /100 | #200 | Fair 47.7% |
| Immigrants | Cuba | 20.9 /100 | #201 | Fair 47.7% |