Immigrants from Burma/Myanmar vs Israeli In Labor Force | Age > 16

COMPARE

Immigrants from Burma/Myanmar
Race
Ancestry
AfghanAfricanAlaska NativeAlaskan AthabascanAlbanianAleutAlsatianAmericanApacheArabArapahoArgentineanArmenianAssyrian/Chaldean/SyriacAustralianAustrianBahamianBangladeshiBarbadianBasqueBelgianBelizeanBermudanBhutaneseBlackfeetBolivianBrazilianBritishBritish West IndianBulgarianBurmeseCajunCambodianCanadianCape VerdeanCarpatho RusynCelticCentral AmericanCentral American IndianCherokeeCheyenneChickasawChileanChineseChippewaChoctawColombianColvilleComancheCosta RicanCreeCreekCroatianCrowCubanCypriotCzechCzechoslovakianDanishDelawareDominicanDutchDutch West IndianEastern EuropeanEcuadorianEgyptianEnglishEstonianEthiopianEuropeanFijianFilipinoFinnishFrenchFrench American IndianFrench CanadianGermanGerman RussianGhanaianGreekGuamanian/ChamorroGuatemalanGuyaneseHaitianHmongHonduranHopiHoumaHungarianIcelanderIndian (Asian)IndonesianInupiatIranianIraqiIrishIroquoisItalianJamaicanJapaneseJordanianKenyanKiowaKoreanLaotianLatvianLebaneseLiberianLithuanianLumbeeLuxembourgerMacedonianMalaysianMalteseMarshalleseMenomineeMexicanMexican American IndianMongolianMoroccanNative HawaiianNavajoNepaleseNew ZealanderNicaraguanNigerianNorthern EuropeanNorwegianOkinawanOsageOttawaPaiutePakistaniPalestinianPanamanianParaguayanPennsylvania GermanPeruvianPimaPolishPortuguesePotawatomiPuebloPuerto RicanPuget Sound SalishRomanianRussianSalvadoranSamoanScandinavianScotch-IrishScottishSeminoleSenegaleseSerbianShoshoneSierra LeoneanSiouxSlavicSlovakSloveneSomaliSouth AfricanSouth AmericanSouth American IndianSoviet UnionSpaniardSpanishSpanish AmericanSpanish American IndianSri LankanSubsaharan AfricanSudaneseSwedishSwissSyrianTaiwaneseThaiTlingit-HaidaTohono O'OdhamTonganTrinidadian and TobagonianTsimshianTurkishU.S. Virgin IslanderUgandanUkrainianUruguayanUteVenezuelanVietnameseWelshWest IndianYakamaYaquiYugoslavianYumanYup'ikZimbabwean
Immigration
NonimmigrantsImmigrantsAfghanistanAfricaAlbaniaArgentinaArmeniaAsiaAustraliaAustriaBahamasBangladeshBarbadosBelarusBelgiumBelizeBoliviaBosnia and HerzegovinaBrazilBulgariaBurma/MyanmarCabo VerdeCambodiaCameroonCanadaCaribbeanCentral AmericaChileChinaColombiaCongoCosta RicaCroatiaCubaCzechoslovakiaDenmarkDominicaDominican RepublicEastern AfricaEastern AsiaEastern EuropeEcuadorEgyptEl SalvadorEnglandEritreaEthiopiaEuropeFijiFranceGermanyGhanaGreeceGrenadaGuatemalaGuyanaHaitiHondurasHong KongHungaryIndiaIndonesiaIranIraqIrelandIsraelItalyJamaicaJapanJordanKazakhstanKenyaKoreaKuwaitLaosLatin AmericaLatviaLebanonLiberiaLithuaniaMalaysiaMexicoMicronesiaMiddle AfricaMoldovaMoroccoNepalNetherlandsNicaraguaNigeriaNorth AmericaNorth MacedoniaNorthern AfricaNorthern EuropeNorwayOceaniaPakistanPanamaPeruPhilippinesPolandPortugalRomaniaRussiaSaudi ArabiaScotlandSenegalSerbiaSierra LeoneSingaporeSomaliaSouth AfricaSouth AmericaSouth Central AsiaSouth Eastern AsiaSouthern EuropeSpainSri LankaSt. Vincent and the GrenadinesSudanSwedenSwitzerlandSyriaTaiwanThailandTrinidad and TobagoTurkeyUgandaUkraineUruguayUzbekistanVenezuelaVietnamWest IndiesWestern AfricaWestern AsiaWestern EuropeYemenZaireZimbabweAzores
Israeli
Race
Ancestry
AfghanAfricanAlaska NativeAlaskan AthabascanAlbanianAleutAlsatianAmericanApacheArabArapahoArgentineanArmenianAssyrian/Chaldean/SyriacAustralianAustrianBahamianBangladeshiBarbadianBasqueBelgianBelizeanBermudanBhutaneseBlackfeetBolivianBrazilianBritishBritish West IndianBulgarianBurmeseCajunCambodianCanadianCape VerdeanCarpatho RusynCelticCentral AmericanCentral American IndianCherokeeCheyenneChickasawChileanChineseChippewaChoctawColombianColvilleComancheCosta RicanCreeCreekCroatianCrowCubanCypriotCzechCzechoslovakianDanishDelawareDominicanDutchDutch West IndianEastern EuropeanEcuadorianEgyptianEnglishEstonianEthiopianEuropeanFijianFilipinoFinnishFrenchFrench American IndianFrench CanadianGermanGerman RussianGhanaianGreekGuamanian/ChamorroGuatemalanGuyaneseHaitianHmongHonduranHopiHoumaHungarianIcelanderIndian (Asian)IndonesianInupiatIranianIraqiIrishIroquoisIsraeliItalianJamaicanJapaneseJordanianKenyanKiowaKoreanLaotianLatvianLebaneseLiberianLithuanianLumbeeLuxembourgerMacedonianMalaysianMalteseMarshalleseMenomineeMexicanMexican American IndianMongolianMoroccanNative HawaiianNavajoNepaleseNew ZealanderNicaraguanNigerianNorthern EuropeanNorwegianOkinawanOsageOttawaPaiutePakistaniPalestinianPanamanianParaguayanPennsylvania GermanPeruvianPimaPolishPortuguesePotawatomiPuebloPuerto RicanPuget Sound SalishRomanianRussianSalvadoranSamoanScandinavianScotch-IrishScottishSeminoleSenegaleseSerbianShoshoneSierra LeoneanSiouxSlavicSlovakSloveneSomaliSouth AfricanSouth AmericanSouth American IndianSoviet UnionSpaniardSpanishSpanish AmericanSpanish American IndianSri LankanSubsaharan AfricanSudaneseSwedishSwissSyrianTaiwaneseThaiTlingit-HaidaTohono O'OdhamTonganTrinidadian and TobagonianTsimshianTurkishU.S. Virgin IslanderUgandanUkrainianUruguayanUteVenezuelanVietnameseWelshWest IndianYakamaYaquiYugoslavianYumanYup'ikZimbabwean
Immigration
NonimmigrantsImmigrantsAfghanistanAfricaAlbaniaArgentinaArmeniaAsiaAustraliaAustriaBahamasBangladeshBarbadosBelarusBelgiumBelizeBoliviaBosnia and HerzegovinaBrazilBulgariaCabo VerdeCambodiaCameroonCanadaCaribbeanCentral AmericaChileChinaColombiaCongoCosta RicaCroatiaCubaCzechoslovakiaDenmarkDominicaDominican RepublicEastern AfricaEastern AsiaEastern EuropeEcuadorEgyptEl SalvadorEnglandEritreaEthiopiaEuropeFijiFranceGermanyGhanaGreeceGrenadaGuatemalaGuyanaHaitiHondurasHong KongHungaryIndiaIndonesiaIranIraqIrelandIsraelItalyJamaicaJapanJordanKazakhstanKenyaKoreaKuwaitLaosLatin AmericaLatviaLebanonLiberiaLithuaniaMalaysiaMexicoMicronesiaMiddle AfricaMoldovaMoroccoNepalNetherlandsNicaraguaNigeriaNorth AmericaNorth MacedoniaNorthern AfricaNorthern EuropeNorwayOceaniaPakistanPanamaPeruPhilippinesPolandPortugalRomaniaRussiaSaudi ArabiaScotlandSenegalSerbiaSierra LeoneSingaporeSomaliaSouth AfricaSouth AmericaSouth Central AsiaSouth Eastern AsiaSouthern EuropeSpainSri LankaSt. Vincent and the GrenadinesSudanSwedenSwitzerlandSyriaTaiwanThailandTrinidad and TobagoTurkeyUgandaUkraineUruguayUzbekistanVenezuelaVietnamWest IndiesWestern AfricaWestern AsiaWestern EuropeYemenZaireZimbabweAzores
In Labor Force | Age > 16
Income
Poverty
Unemployment
Labor Participation
Family Structure
Vehicle Availability
Education Level
Disability

In Labor Force | Age > 16 Comparison

Immigrants from Burma/Myanmar

Israelis

Exceptional
Good
66.3%
IN LABOR FORCE | AGE > 16
99.8/ 100
METRIC RATING
61st/ 347
METRIC RANK
65.2%
IN LABOR FORCE | AGE > 16
61.6/ 100
METRIC RATING
171st/ 347
METRIC RANK

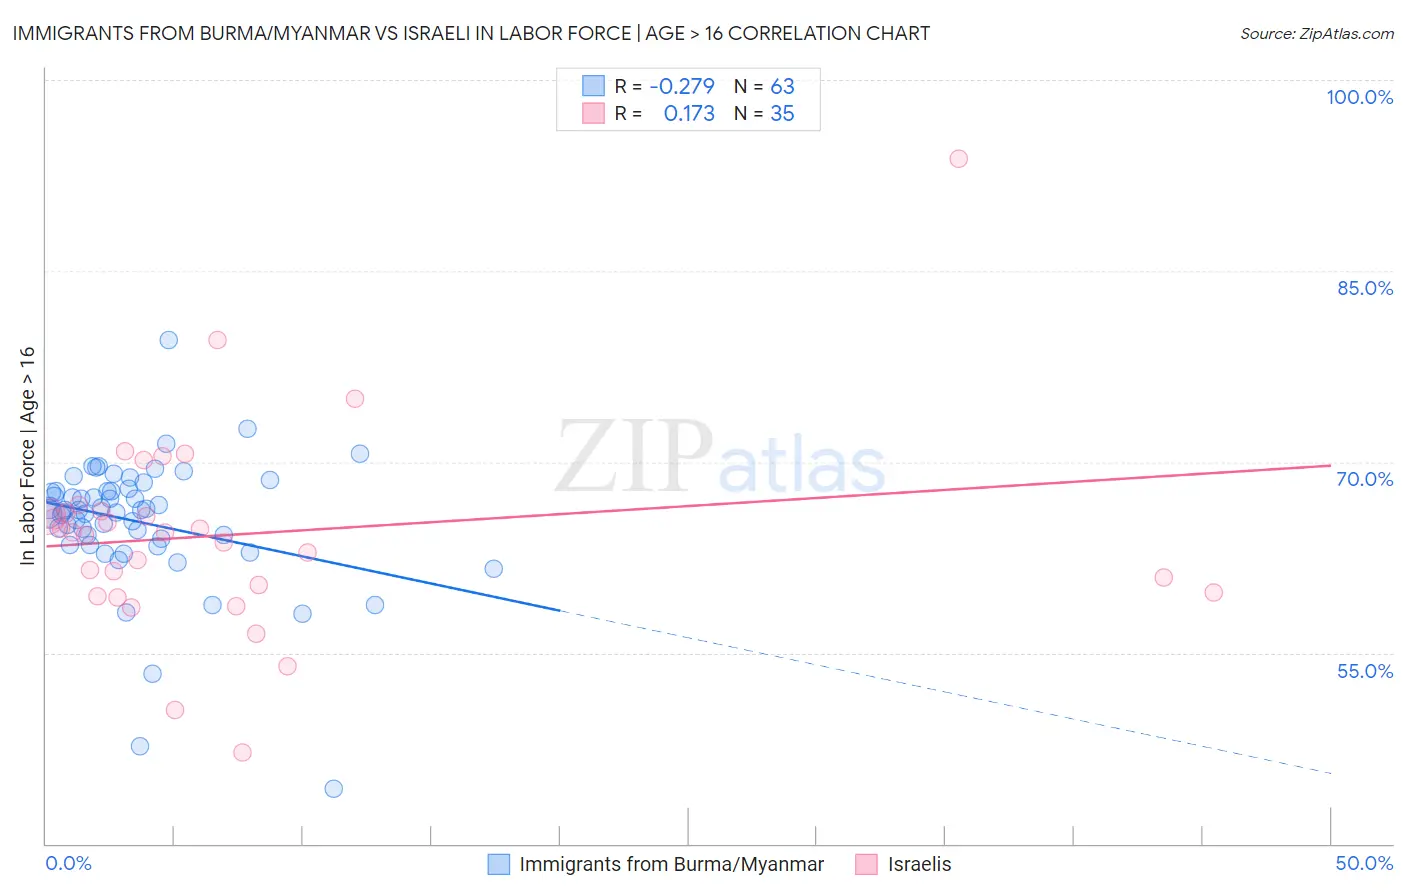
Immigrants from Burma/Myanmar vs Israeli In Labor Force | Age > 16 Correlation Chart

The statistical analysis conducted on geographies consisting of 172,361,065 people shows a weak negative correlation between the proportion of Immigrants from Burma/Myanmar and labor force participation rate among population ages 16 and over in the United States with a correlation coefficient (R) of -0.279 and weighted average of 66.3%. Similarly, the statistical analysis conducted on geographies consisting of 211,218,768 people shows a poor positive correlation between the proportion of Israelis and labor force participation rate among population ages 16 and over in the United States with a correlation coefficient (R) of 0.173 and weighted average of 65.2%, a difference of 1.7%.
Immigrants from Burma/Myanmar vs Israeli In Labor Force | Age > 16

In Labor Force | Age > 16 Correlation Summary

MeasurementImmigrants from Burma/MyanmarIsraeli
Minimum44.3%47.2%
Maximum79.6%93.8%
Range35.3%46.6%
Mean65.3%64.3%
Median66.2%64.4%
Interquartile 25% (IQ1)63.5%59.7%
Interquartile 75% (IQ3)67.7%66.1%
Interquartile Range (IQR)4.2%6.4%
Standard Deviation (Sample)5.2%8.1%
Standard Deviation (Population)5.2%8.0%

Similar Demographics by In Labor Force | Age > 16

Demographics Similar to Immigrants from Burma/Myanmar by In Labor Force | Age > 16

In terms of in labor force | age > 16, the demographic groups most similar to Immigrants from Burma/Myanmar are Immigrants from Peru (66.3%, a difference of 0.0%), Indonesian (66.3%, a difference of 0.0%), Immigrants from Turkey (66.3%, a difference of 0.030%), Venezuelan (66.3%, a difference of 0.040%), and Peruvian (66.3%, a difference of 0.040%).
DemographicsRating | RankIn Labor Force | Age > 16
Immigrants | Bosnia and Herzegovina
99.9
/100
|
#54
Exceptional
66.5%
Immigrants | Venezuela
99.9
/100
|
#55
Exceptional
66.4%
Immigrants | Senegal
99.9
/100
|
#56
Exceptional
66.4%
Bulgarians
99.9
/100
|
#57
Exceptional
66.4%
Immigrants | Saudi Arabia
99.9
/100
|
#58
Exceptional
66.3%
Immigrants | Turkey
99.9
/100
|
#59
Exceptional
66.3%
Immigrants | Peru
99.8
/100
|
#60
Exceptional
66.3%
Immigrants | Burma/Myanmar
99.8
/100
|
#61
Exceptional
66.3%
Indonesians
99.8
/100
|
#62
Exceptional
66.3%
Venezuelans
99.8
/100
|
#63
Exceptional
66.3%
Peruvians
99.8
/100
|
#64
Exceptional
66.3%
Sri Lankans
99.8
/100
|
#65
Exceptional
66.3%
Jordanians
99.8
/100
|
#66
Exceptional
66.3%
Egyptians
99.8
/100
|
#67
Exceptional
66.2%
Immigrants | Egypt
99.7
/100
|
#68
Exceptional
66.2%

Demographics Similar to Israelis by In Labor Force | Age > 16

In terms of in labor force | age > 16, the demographic groups most similar to Israelis are Immigrants from Israel (65.2%, a difference of 0.0%), Immigrants from Sweden (65.2%, a difference of 0.0%), Arab (65.2%, a difference of 0.010%), Serbian (65.2%, a difference of 0.020%), and Immigrants from Belarus (65.2%, a difference of 0.050%).
DemographicsRating | RankIn Labor Force | Age > 16
Danes
68.8
/100
|
#164
Good
65.3%
Immigrants | Kazakhstan
68.1
/100
|
#165
Good
65.3%
Immigrants | Western Asia
67.3
/100
|
#166
Good
65.3%
Immigrants | Belarus
66.0
/100
|
#167
Good
65.2%
Serbians
63.5
/100
|
#168
Good
65.2%
Arabs
62.4
/100
|
#169
Good
65.2%
Immigrants | Israel
61.7
/100
|
#170
Good
65.2%
Israelis
61.6
/100
|
#171
Good
65.2%
Immigrants | Sweden
61.3
/100
|
#172
Good
65.2%
Immigrants | Ukraine
53.7
/100
|
#173
Average
65.1%
Macedonians
50.0
/100
|
#174
Average
65.1%
Nicaraguans
49.7
/100
|
#175
Average
65.1%
Swedes
47.4
/100
|
#176
Average
65.1%
Eastern Europeans
46.2
/100
|
#177
Average
65.1%
Trinidadians and Tobagonians
45.2
/100
|
#178
Average
65.1%