Immigrants from Asia vs Osage In Labor Force | Age 30-34

COMPARE

Immigrants from Asia
Race
Ancestry
AfghanAfricanAlaska NativeAlaskan AthabascanAlbanianAleutAlsatianAmericanApacheArabArapahoArgentineanArmenianAssyrian/Chaldean/SyriacAustralianAustrianBahamianBangladeshiBarbadianBasqueBelgianBelizeanBermudanBhutaneseBlackfeetBolivianBrazilianBritishBritish West IndianBulgarianBurmeseCajunCambodianCanadianCape VerdeanCarpatho RusynCelticCentral AmericanCentral American IndianCherokeeCheyenneChickasawChileanChineseChippewaChoctawColombianColvilleComancheCosta RicanCreeCreekCroatianCrowCubanCypriotCzechCzechoslovakianDanishDelawareDominicanDutchDutch West IndianEastern EuropeanEcuadorianEgyptianEnglishEstonianEthiopianEuropeanFijianFilipinoFinnishFrenchFrench American IndianFrench CanadianGermanGerman RussianGhanaianGreekGuamanian/ChamorroGuatemalanGuyaneseHaitianHmongHonduranHopiHoumaHungarianIcelanderIndian (Asian)IndonesianInupiatIranianIraqiIrishIroquoisIsraeliItalianJamaicanJapaneseJordanianKenyanKiowaKoreanLaotianLatvianLebaneseLiberianLithuanianLumbeeLuxembourgerMacedonianMalaysianMalteseMarshalleseMenomineeMexicanMexican American IndianMongolianMoroccanNative HawaiianNavajoNepaleseNew ZealanderNicaraguanNigerianNorthern EuropeanNorwegianOkinawanOttawaPaiutePakistaniPalestinianPanamanianParaguayanPennsylvania GermanPeruvianPimaPolishPortuguesePotawatomiPuebloPuerto RicanPuget Sound SalishRomanianRussianSalvadoranSamoanScandinavianScotch-IrishScottishSeminoleSenegaleseSerbianShoshoneSierra LeoneanSiouxSlavicSlovakSloveneSomaliSouth AfricanSouth AmericanSouth American IndianSoviet UnionSpaniardSpanishSpanish AmericanSpanish American IndianSri LankanSubsaharan AfricanSudaneseSwedishSwissSyrianTaiwaneseThaiTlingit-HaidaTohono O'OdhamTonganTrinidadian and TobagonianTsimshianTurkishU.S. Virgin IslanderUgandanUkrainianUruguayanUteVenezuelanVietnameseWelshWest IndianYakamaYaquiYugoslavianYumanYup'ikZimbabwean
Immigration
NonimmigrantsImmigrantsAfghanistanAfricaAlbaniaArgentinaArmeniaAsiaAustraliaAustriaBahamasBangladeshBarbadosBelarusBelgiumBelizeBoliviaBosnia and HerzegovinaBrazilBulgariaBurma/MyanmarCabo VerdeCambodiaCameroonCanadaCaribbeanCentral AmericaChileChinaColombiaCongoCosta RicaCroatiaCubaCzechoslovakiaDenmarkDominicaDominican RepublicEastern AfricaEastern AsiaEastern EuropeEcuadorEgyptEl SalvadorEnglandEritreaEthiopiaEuropeFijiFranceGermanyGhanaGreeceGrenadaGuatemalaGuyanaHaitiHondurasHong KongHungaryIndiaIndonesiaIranIraqIrelandIsraelItalyJamaicaJapanJordanKazakhstanKenyaKoreaKuwaitLaosLatin AmericaLatviaLebanonLiberiaLithuaniaMalaysiaMexicoMicronesiaMiddle AfricaMoldovaMoroccoNepalNetherlandsNicaraguaNigeriaNorth AmericaNorth MacedoniaNorthern AfricaNorthern EuropeNorwayOceaniaPakistanPanamaPeruPhilippinesPolandPortugalRomaniaRussiaSaudi ArabiaScotlandSenegalSerbiaSierra LeoneSingaporeSomaliaSouth AfricaSouth AmericaSouth Central AsiaSouth Eastern AsiaSouthern EuropeSpainSri LankaSt. Vincent and the GrenadinesSudanSwedenSwitzerlandSyriaTaiwanThailandTrinidad and TobagoTurkeyUgandaUkraineUruguayUzbekistanVenezuelaVietnamWest IndiesWestern AfricaWestern AsiaWestern EuropeYemenZaireZimbabweAzores
Osage
Race
Ancestry
AfghanAfricanAlaska NativeAlaskan AthabascanAlbanianAleutAlsatianAmericanApacheArabArapahoArgentineanArmenianAssyrian/Chaldean/SyriacAustralianAustrianBahamianBangladeshiBarbadianBasqueBelgianBelizeanBermudanBhutaneseBlackfeetBolivianBrazilianBritishBritish West IndianBulgarianBurmeseCajunCambodianCanadianCape VerdeanCarpatho RusynCelticCentral AmericanCentral American IndianCherokeeCheyenneChickasawChileanChineseChippewaChoctawColombianColvilleComancheCosta RicanCreeCreekCroatianCrowCubanCypriotCzechCzechoslovakianDanishDelawareDominicanDutchDutch West IndianEastern EuropeanEcuadorianEgyptianEnglishEstonianEthiopianEuropeanFijianFilipinoFinnishFrenchFrench American IndianFrench CanadianGermanGerman RussianGhanaianGreekGuamanian/ChamorroGuatemalanGuyaneseHaitianHmongHonduranHopiHoumaHungarianIcelanderIndian (Asian)IndonesianInupiatIranianIraqiIrishIroquoisIsraeliItalianJamaicanJapaneseJordanianKenyanKiowaKoreanLaotianLatvianLebaneseLiberianLithuanianLumbeeLuxembourgerMacedonianMalaysianMalteseMarshalleseMenomineeMexicanMexican American IndianMongolianMoroccanNative HawaiianNavajoNepaleseNew ZealanderNicaraguanNigerianNorthern EuropeanNorwegianOkinawanOsageOttawaPaiutePakistaniPalestinianPanamanianParaguayanPennsylvania GermanPeruvianPimaPolishPortuguesePotawatomiPuebloPuerto RicanPuget Sound SalishRomanianRussianSalvadoranSamoanScandinavianScotch-IrishScottishSeminoleSenegaleseSerbianShoshoneSierra LeoneanSiouxSlavicSlovakSloveneSomaliSouth AfricanSouth AmericanSouth American IndianSoviet UnionSpaniardSpanishSpanish AmericanSpanish American IndianSri LankanSubsaharan AfricanSudaneseSwedishSwissSyrianTaiwaneseThaiTlingit-HaidaTohono O'OdhamTonganTrinidadian and TobagonianTsimshianTurkishU.S. Virgin IslanderUgandanUkrainianUruguayanUteVenezuelanVietnameseWelshWest IndianYakamaYaquiYugoslavianYumanYup'ikZimbabwean
Immigration
NonimmigrantsImmigrantsAfghanistanAfricaAlbaniaArgentinaArmeniaAustraliaAustriaBahamasBangladeshBarbadosBelarusBelgiumBelizeBoliviaBosnia and HerzegovinaBrazilBulgariaBurma/MyanmarCabo VerdeCambodiaCameroonCanadaCaribbeanCentral AmericaChileChinaColombiaCongoCosta RicaCroatiaCubaCzechoslovakiaDenmarkDominicaDominican RepublicEastern AfricaEastern AsiaEastern EuropeEcuadorEgyptEl SalvadorEnglandEritreaEthiopiaEuropeFijiFranceGermanyGhanaGreeceGrenadaGuatemalaGuyanaHaitiHondurasHong KongHungaryIndiaIndonesiaIranIraqIrelandIsraelItalyJamaicaJapanJordanKazakhstanKenyaKoreaKuwaitLaosLatin AmericaLatviaLebanonLiberiaLithuaniaMalaysiaMexicoMicronesiaMiddle AfricaMoldovaMoroccoNepalNetherlandsNicaraguaNigeriaNorth AmericaNorth MacedoniaNorthern AfricaNorthern EuropeNorwayOceaniaPakistanPanamaPeruPhilippinesPolandPortugalRomaniaRussiaSaudi ArabiaScotlandSenegalSerbiaSierra LeoneSingaporeSomaliaSouth AfricaSouth AmericaSouth Central AsiaSouth Eastern AsiaSouthern EuropeSpainSri LankaSt. Vincent and the GrenadinesSudanSwedenSwitzerlandSyriaTaiwanThailandTrinidad and TobagoTurkeyUgandaUkraineUruguayUzbekistanVenezuelaVietnamWest IndiesWestern AfricaWestern AsiaWestern EuropeYemenZaireZimbabweAzores
In Labor Force | Age 30-34
Income
Poverty
Unemployment
Labor Participation
Family Structure
Vehicle Availability
Education Level
Disability

In Labor Force | Age 30-34 Comparison

Immigrants from Asia

Osage

Excellent
Tragic
85.0%
IN LABOR FORCE | AGE 30-34
88.9/ 100
METRIC RATING
135th/ 347
METRIC RANK
82.3%
IN LABOR FORCE | AGE 30-34
0.0/ 100
METRIC RATING
305th/ 347
METRIC RANK

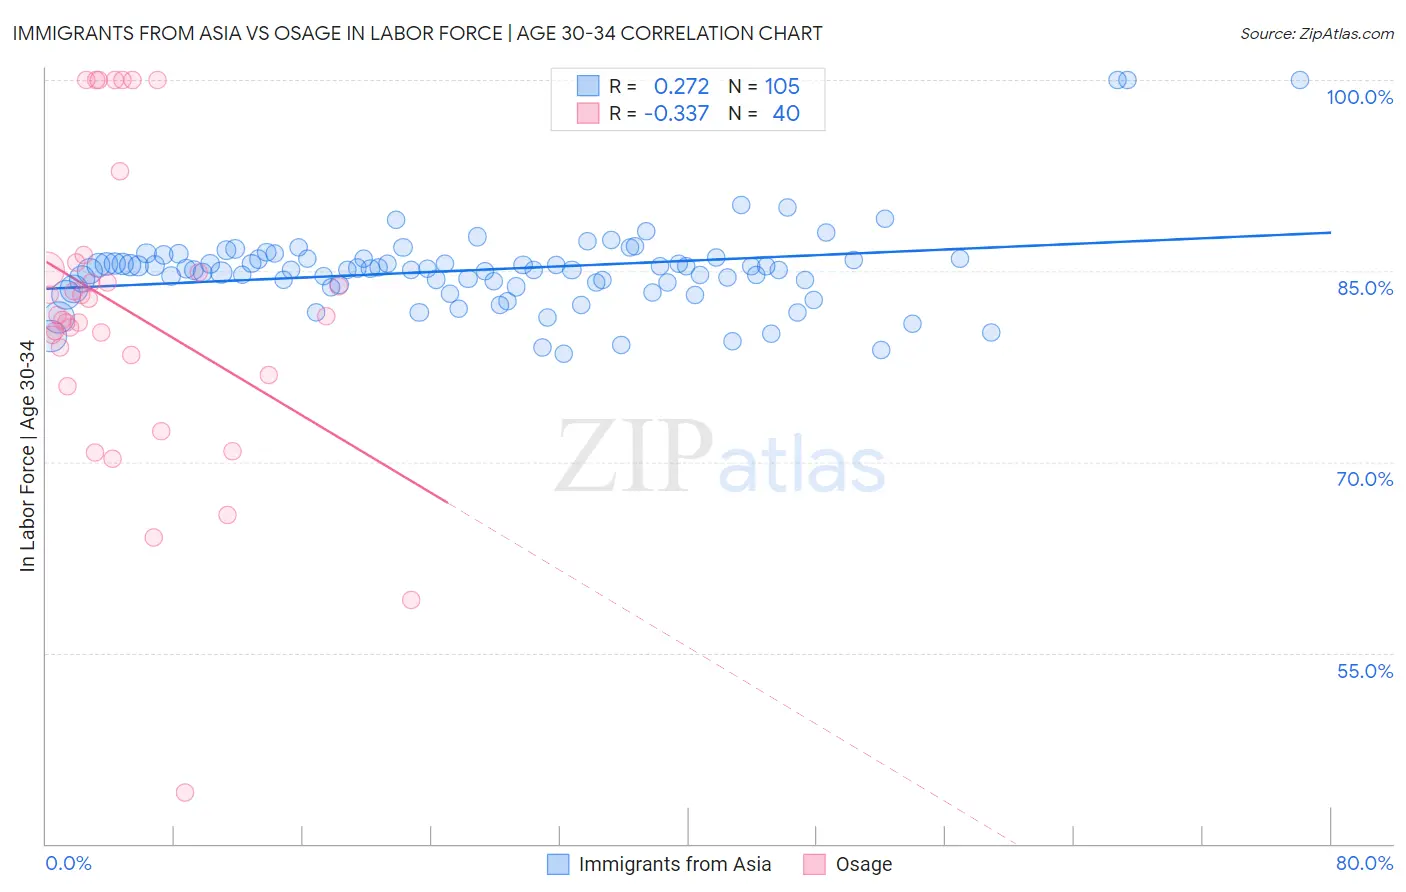
Immigrants from Asia vs Osage In Labor Force | Age 30-34 Correlation Chart

The statistical analysis conducted on geographies consisting of 548,380,384 people shows a weak positive correlation between the proportion of Immigrants from Asia and labor force participation rate among population between the ages 30 and 34 in the United States with a correlation coefficient (R) of 0.272 and weighted average of 85.0%. Similarly, the statistical analysis conducted on geographies consisting of 91,795,365 people shows a mild negative correlation between the proportion of Osage and labor force participation rate among population between the ages 30 and 34 in the United States with a correlation coefficient (R) of -0.337 and weighted average of 82.3%, a difference of 3.3%.
Immigrants from Asia vs Osage In Labor Force | Age 30-34

In Labor Force | Age 30-34 Correlation Summary

MeasurementImmigrants from AsiaOsage
Minimum78.5%44.0%
Maximum100.0%100.0%
Range21.5%56.0%
Mean85.1%81.8%
Median85.1%81.5%
Interquartile 25% (IQ1)83.8%77.6%
Interquartile 75% (IQ3)86.0%85.4%
Interquartile Range (IQR)2.2%7.8%
Standard Deviation (Sample)3.4%12.0%
Standard Deviation (Population)3.4%11.8%

Similar Demographics by In Labor Force | Age 30-34

Demographics Similar to Immigrants from Asia by In Labor Force | Age 30-34

In terms of in labor force | age 30-34, the demographic groups most similar to Immigrants from Asia are Immigrants from Chile (85.0%, a difference of 0.0%), Chinese (85.0%, a difference of 0.010%), Immigrants from Israel (85.0%, a difference of 0.010%), New Zealander (85.0%, a difference of 0.010%), and Jordanian (85.0%, a difference of 0.010%).
DemographicsRating | RankIn Labor Force | Age 30-34
Immigrants | Argentina
90.6
/100
|
#128
Exceptional
85.0%
Immigrants | Western Africa
90.2
/100
|
#129
Exceptional
85.0%
Immigrants | Spain
90.0
/100
|
#130
Exceptional
85.0%
Chinese
89.6
/100
|
#131
Excellent
85.0%
Immigrants | Israel
89.5
/100
|
#132
Excellent
85.0%
New Zealanders
89.5
/100
|
#133
Excellent
85.0%
Immigrants | Chile
89.2
/100
|
#134
Excellent
85.0%
Immigrants | Asia
88.9
/100
|
#135
Excellent
85.0%
Jordanians
88.6
/100
|
#136
Excellent
85.0%
South Africans
88.0
/100
|
#137
Excellent
85.0%
Sri Lankans
87.8
/100
|
#138
Excellent
85.0%
Bhutanese
87.5
/100
|
#139
Excellent
85.0%
Immigrants | Vietnam
86.5
/100
|
#140
Excellent
85.0%
Chileans
85.3
/100
|
#141
Excellent
84.9%
Immigrants | Indonesia
84.3
/100
|
#142
Excellent
84.9%

Demographics Similar to Osage by In Labor Force | Age 30-34

In terms of in labor force | age 30-34, the demographic groups most similar to Osage are Spanish American Indian (82.2%, a difference of 0.020%), Menominee (82.2%, a difference of 0.070%), Tlingit-Haida (82.3%, a difference of 0.080%), Immigrants from Micronesia (82.4%, a difference of 0.16%), and Ottawa (82.4%, a difference of 0.17%).
DemographicsRating | RankIn Labor Force | Age 30-34
Aleuts
0.0
/100
|
#298
Tragic
82.6%
Immigrants | Central America
0.0
/100
|
#299
Tragic
82.5%
Hmong
0.0
/100
|
#300
Tragic
82.4%
Hispanics or Latinos
0.0
/100
|
#301
Tragic
82.4%
Ottawa
0.0
/100
|
#302
Tragic
82.4%
Immigrants | Micronesia
0.0
/100
|
#303
Tragic
82.4%
Tlingit-Haida
0.0
/100
|
#304
Tragic
82.3%
Osage
0.0
/100
|
#305
Tragic
82.3%
Spanish American Indians
0.0
/100
|
#306
Tragic
82.2%
Menominee
0.0
/100
|
#307
Tragic
82.2%
Puget Sound Salish
0.0
/100
|
#308
Tragic
82.1%
Immigrants | Mexico
0.0
/100
|
#309
Tragic
82.0%
Cajuns
0.0
/100
|
#310
Tragic
82.0%
Chickasaw
0.0
/100
|
#311
Tragic
81.9%
Mexicans
0.0
/100
|
#312
Tragic
81.9%