Choctaw vs Immigrants from Grenada In Labor Force | Age 20-64
COMPARE
Choctaw
Immigrants from Grenada
In Labor Force | Age 20-64
In Labor Force | Age 20-64 Comparison
Choctaw
Immigrants from Grenada
75.4%
IN LABOR FORCE | AGE 20-64
0.0/ 100
METRIC RATING
324th/ 347
METRIC RANK
77.7%
IN LABOR FORCE | AGE 20-64
0.0/ 100
METRIC RATING
295th/ 347
METRIC RANK
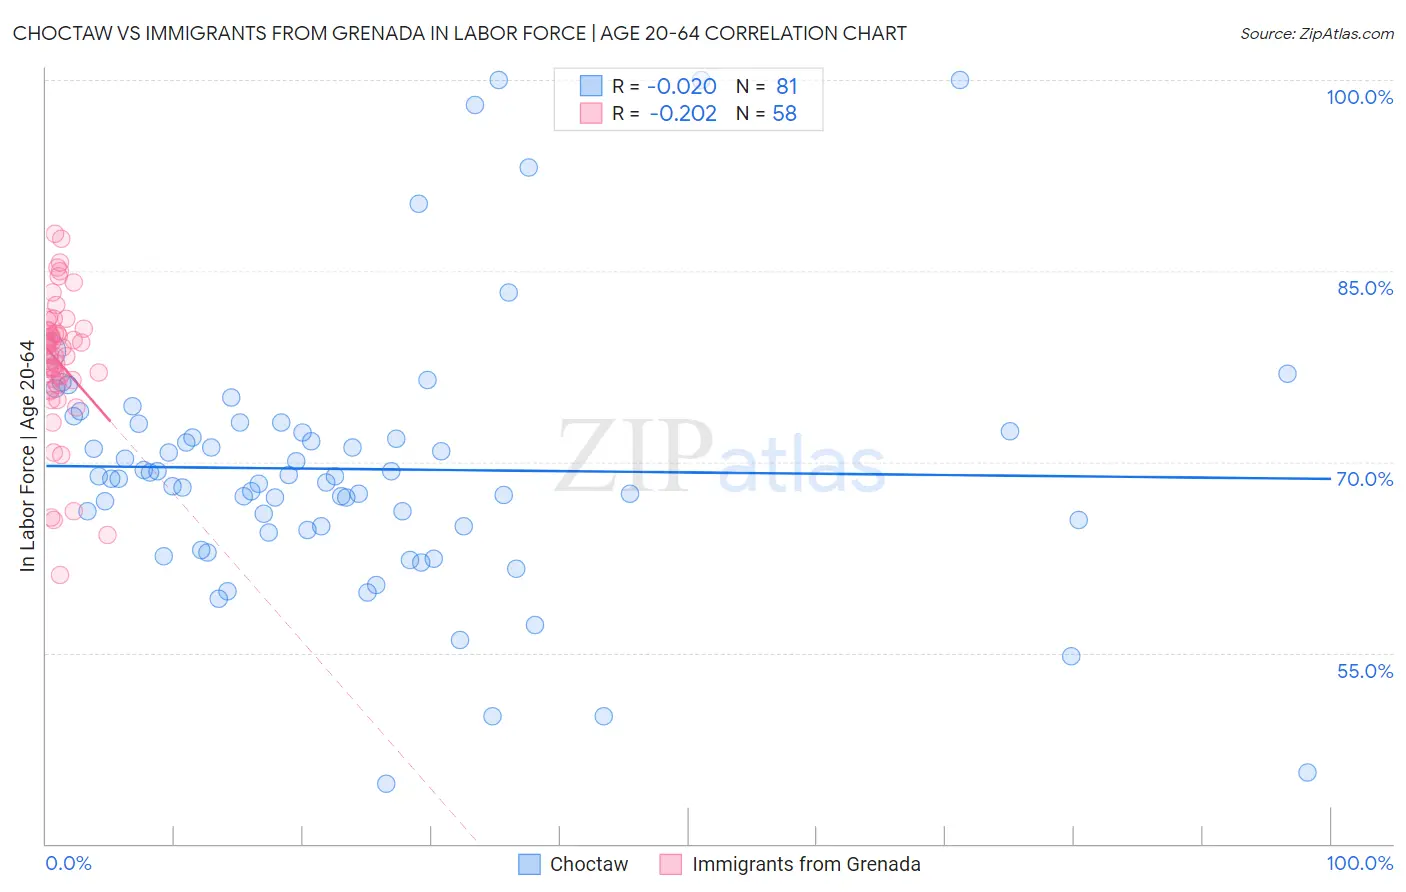
Choctaw vs Immigrants from Grenada In Labor Force | Age 20-64 Correlation Chart
The statistical analysis conducted on geographies consisting of 269,719,618 people shows no correlation between the proportion of Choctaw and labor force participation rate among population between the ages 20 and 64 in the United States with a correlation coefficient (R) of -0.020 and weighted average of 75.4%. Similarly, the statistical analysis conducted on geographies consisting of 67,201,096 people shows a weak negative correlation between the proportion of Immigrants from Grenada and labor force participation rate among population between the ages 20 and 64 in the United States with a correlation coefficient (R) of -0.202 and weighted average of 77.7%, a difference of 3.0%.
In Labor Force | Age 20-64 Correlation Summary
| Measurement | Choctaw | Immigrants from Grenada |
| Minimum | 44.7% | 61.1% |
| Maximum | 100.0% | 87.9% |
| Range | 55.3% | 26.8% |
| Mean | 69.4% | 77.9% |
| Median | 68.7% | 78.8% |
| Interquartile 25% (IQ1) | 64.8% | 76.4% |
| Interquartile 75% (IQ3) | 72.7% | 80.4% |
| Interquartile Range (IQR) | 7.9% | 4.0% |
| Standard Deviation (Sample) | 10.4% | 5.4% |
| Standard Deviation (Population) | 10.4% | 5.4% |
Similar Demographics by In Labor Force | Age 20-64
Demographics Similar to Choctaw by In Labor Force | Age 20-64
In terms of in labor force | age 20-64, the demographic groups most similar to Choctaw are Cajun (75.5%, a difference of 0.060%), Dutch West Indian (75.5%, a difference of 0.10%), Seminole (75.5%, a difference of 0.14%), Menominee (75.3%, a difference of 0.14%), and Creek (75.1%, a difference of 0.36%).
| Demographics | Rating | Rank | In Labor Force | Age 20-64 |
| Cherokee | 0.0 /100 | #317 | Tragic 76.2% |
| Chickasaw | 0.0 /100 | #318 | Tragic 76.2% |
| Inupiat | 0.0 /100 | #319 | Tragic 76.1% |
| Yakama | 0.0 /100 | #320 | Tragic 75.8% |
| Seminole | 0.0 /100 | #321 | Tragic 75.5% |
| Dutch West Indians | 0.0 /100 | #322 | Tragic 75.5% |
| Cajuns | 0.0 /100 | #323 | Tragic 75.5% |
| Choctaw | 0.0 /100 | #324 | Tragic 75.4% |
| Menominee | 0.0 /100 | #325 | Tragic 75.3% |
| Creek | 0.0 /100 | #326 | Tragic 75.1% |
| Sioux | 0.0 /100 | #327 | Tragic 75.0% |
| Kiowa | 0.0 /100 | #328 | Tragic 75.0% |
| Cheyenne | 0.0 /100 | #329 | Tragic 74.8% |
| Colville | 0.0 /100 | #330 | Tragic 74.8% |
| Paiute | 0.0 /100 | #331 | Tragic 74.7% |
Demographics Similar to Immigrants from Grenada by In Labor Force | Age 20-64
In terms of in labor force | age 20-64, the demographic groups most similar to Immigrants from Grenada are Immigrants from Central America (77.7%, a difference of 0.030%), Immigrants from Dominican Republic (77.7%, a difference of 0.030%), Dominican (77.7%, a difference of 0.040%), Cree (77.7%, a difference of 0.050%), and Hispanic or Latino (77.6%, a difference of 0.11%).
| Demographics | Rating | Rank | In Labor Force | Age 20-64 |
| Hmong | 0.0 /100 | #288 | Tragic 77.9% |
| Africans | 0.0 /100 | #289 | Tragic 77.9% |
| Immigrants | Bangladesh | 0.0 /100 | #290 | Tragic 77.9% |
| Spanish Americans | 0.0 /100 | #291 | Tragic 77.8% |
| Immigrants | Azores | 0.0 /100 | #292 | Tragic 77.8% |
| Delaware | 0.0 /100 | #293 | Tragic 77.8% |
| Immigrants | Central America | 0.0 /100 | #294 | Tragic 77.7% |
| Immigrants | Grenada | 0.0 /100 | #295 | Tragic 77.7% |
| Immigrants | Dominican Republic | 0.0 /100 | #296 | Tragic 77.7% |
| Dominicans | 0.0 /100 | #297 | Tragic 77.7% |
| Cree | 0.0 /100 | #298 | Tragic 77.7% |
| Hispanics or Latinos | 0.0 /100 | #299 | Tragic 77.6% |
| Spanish American Indians | 0.0 /100 | #300 | Tragic 77.6% |
| Nepalese | 0.0 /100 | #301 | Tragic 77.5% |
| Iroquois | 0.0 /100 | #302 | Tragic 77.5% |