Cajun vs Pennsylvania German In Labor Force | Age 45-54
COMPARE
Cajun
Pennsylvania German
In Labor Force | Age 45-54
In Labor Force | Age 45-54 Comparison
Cajuns
Pennsylvania Germans
78.1%
IN LABOR FORCE | AGE 45-54
0.0/ 100
METRIC RATING
327th/ 347
METRIC RANK
81.6%
IN LABOR FORCE | AGE 45-54
0.2/ 100
METRIC RATING
252nd/ 347
METRIC RANK
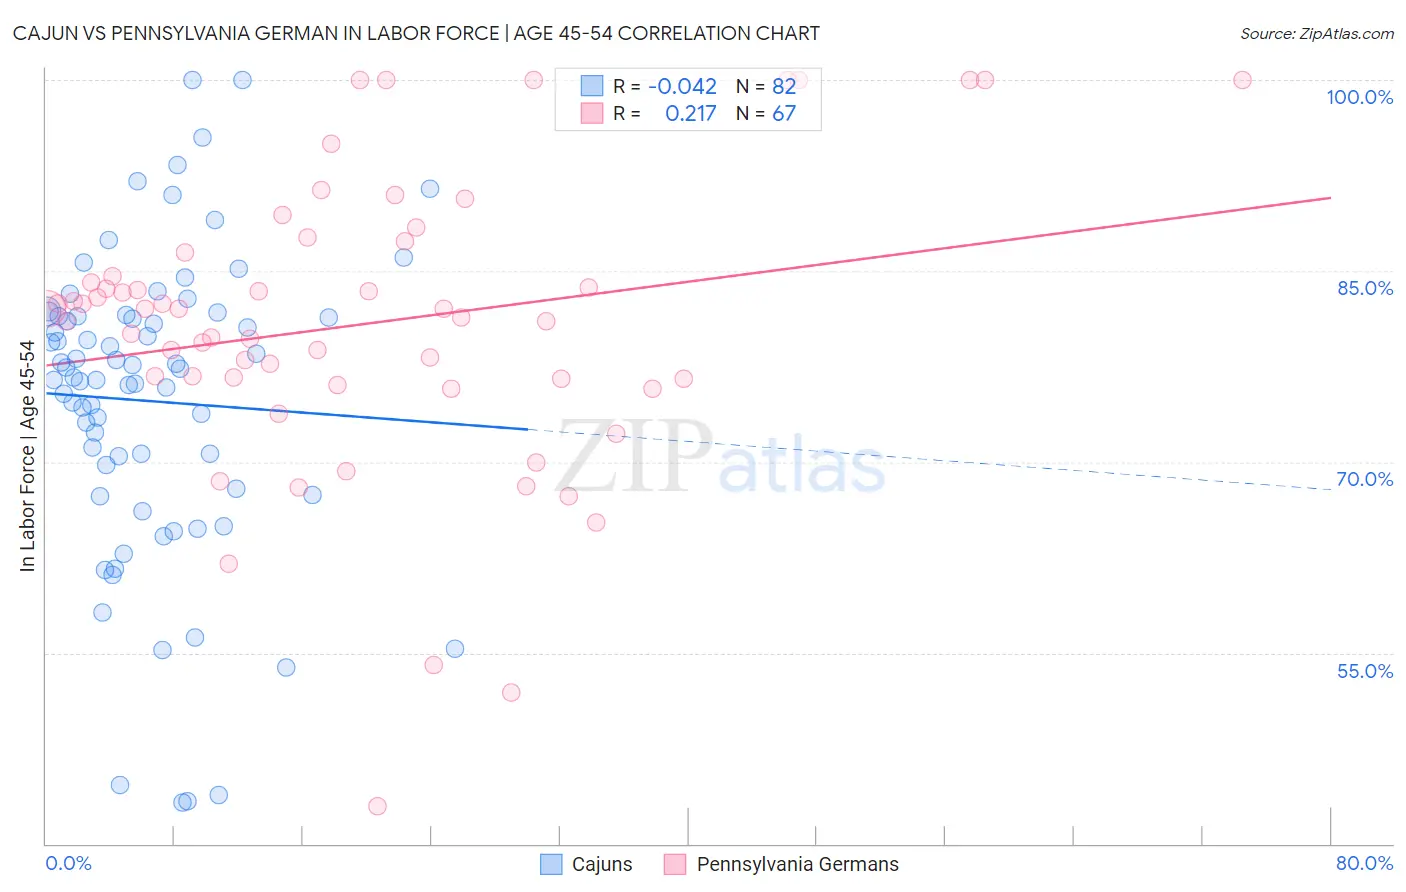
Cajun vs Pennsylvania German In Labor Force | Age 45-54 Correlation Chart
The statistical analysis conducted on geographies consisting of 149,692,418 people shows no correlation between the proportion of Cajuns and labor force participation rate among population between the ages 45 and 54 in the United States with a correlation coefficient (R) of -0.042 and weighted average of 78.1%. Similarly, the statistical analysis conducted on geographies consisting of 234,049,036 people shows a weak positive correlation between the proportion of Pennsylvania Germans and labor force participation rate among population between the ages 45 and 54 in the United States with a correlation coefficient (R) of 0.217 and weighted average of 81.6%, a difference of 4.5%.
In Labor Force | Age 45-54 Correlation Summary
| Measurement | Cajun | Pennsylvania German |
| Minimum | 43.2% | 42.9% |
| Maximum | 100.0% | 100.0% |
| Range | 56.8% | 57.1% |
| Mean | 74.8% | 80.8% |
| Median | 76.9% | 82.0% |
| Interquartile 25% (IQ1) | 67.9% | 76.5% |
| Interquartile 75% (IQ3) | 81.5% | 86.5% |
| Interquartile Range (IQR) | 13.6% | 10.0% |
| Standard Deviation (Sample) | 12.0% | 11.4% |
| Standard Deviation (Population) | 12.0% | 11.3% |
Similar Demographics by In Labor Force | Age 45-54
Demographics Similar to Cajuns by In Labor Force | Age 45-54
In terms of in labor force | age 45-54, the demographic groups most similar to Cajuns are Seminole (78.1%, a difference of 0.0%), Choctaw (78.2%, a difference of 0.050%), Dutch West Indian (78.2%, a difference of 0.15%), Kiowa (78.3%, a difference of 0.16%), and Sioux (78.0%, a difference of 0.22%).
| Demographics | Rating | Rank | In Labor Force | Age 45-54 |
| Yaqui | 0.0 /100 | #320 | Tragic 78.9% |
| Yup'ik | 0.0 /100 | #321 | Tragic 78.6% |
| Crow | 0.0 /100 | #322 | Tragic 78.3% |
| Kiowa | 0.0 /100 | #323 | Tragic 78.3% |
| Dutch West Indians | 0.0 /100 | #324 | Tragic 78.2% |
| Choctaw | 0.0 /100 | #325 | Tragic 78.2% |
| Seminole | 0.0 /100 | #326 | Tragic 78.1% |
| Cajuns | 0.0 /100 | #327 | Tragic 78.1% |
| Sioux | 0.0 /100 | #328 | Tragic 78.0% |
| Creek | 0.0 /100 | #329 | Tragic 77.7% |
| Cheyenne | 0.0 /100 | #330 | Tragic 77.6% |
| Tsimshian | 0.0 /100 | #331 | Tragic 77.4% |
| Menominee | 0.0 /100 | #332 | Tragic 77.4% |
| Natives/Alaskans | 0.0 /100 | #333 | Tragic 77.1% |
| Apache | 0.0 /100 | #334 | Tragic 77.1% |
Demographics Similar to Pennsylvania Germans by In Labor Force | Age 45-54
In terms of in labor force | age 45-54, the demographic groups most similar to Pennsylvania Germans are Guamanian/Chamorro (81.6%, a difference of 0.020%), Japanese (81.6%, a difference of 0.030%), Immigrants from Laos (81.6%, a difference of 0.030%), Immigrants from Armenia (81.7%, a difference of 0.040%), and Scotch-Irish (81.6%, a difference of 0.050%).
| Demographics | Rating | Rank | In Labor Force | Age 45-54 |
| Alaska Natives | 0.4 /100 | #245 | Tragic 81.8% |
| Alaskan Athabascans | 0.4 /100 | #246 | Tragic 81.8% |
| Central Americans | 0.4 /100 | #247 | Tragic 81.7% |
| Puget Sound Salish | 0.3 /100 | #248 | Tragic 81.7% |
| Hmong | 0.3 /100 | #249 | Tragic 81.7% |
| Immigrants | Armenia | 0.2 /100 | #250 | Tragic 81.7% |
| Guamanians/Chamorros | 0.2 /100 | #251 | Tragic 81.6% |
| Pennsylvania Germans | 0.2 /100 | #252 | Tragic 81.6% |
| Japanese | 0.2 /100 | #253 | Tragic 81.6% |
| Immigrants | Laos | 0.2 /100 | #254 | Tragic 81.6% |
| Scotch-Irish | 0.2 /100 | #255 | Tragic 81.6% |
| Barbadians | 0.1 /100 | #256 | Tragic 81.6% |
| Immigrants | Congo | 0.1 /100 | #257 | Tragic 81.6% |
| Immigrants | Fiji | 0.1 /100 | #258 | Tragic 81.5% |
| Guyanese | 0.1 /100 | #259 | Tragic 81.5% |