Cajun vs Immigrants from Eritrea In Labor Force | Age 45-54
COMPARE
Cajun
Immigrants from Eritrea
In Labor Force | Age 45-54
In Labor Force | Age 45-54 Comparison
Cajuns
Immigrants from Eritrea
78.1%
IN LABOR FORCE | AGE 45-54
0.0/ 100
METRIC RATING
327th/ 347
METRIC RANK
83.8%
IN LABOR FORCE | AGE 45-54
99.7/ 100
METRIC RATING
31st/ 347
METRIC RANK
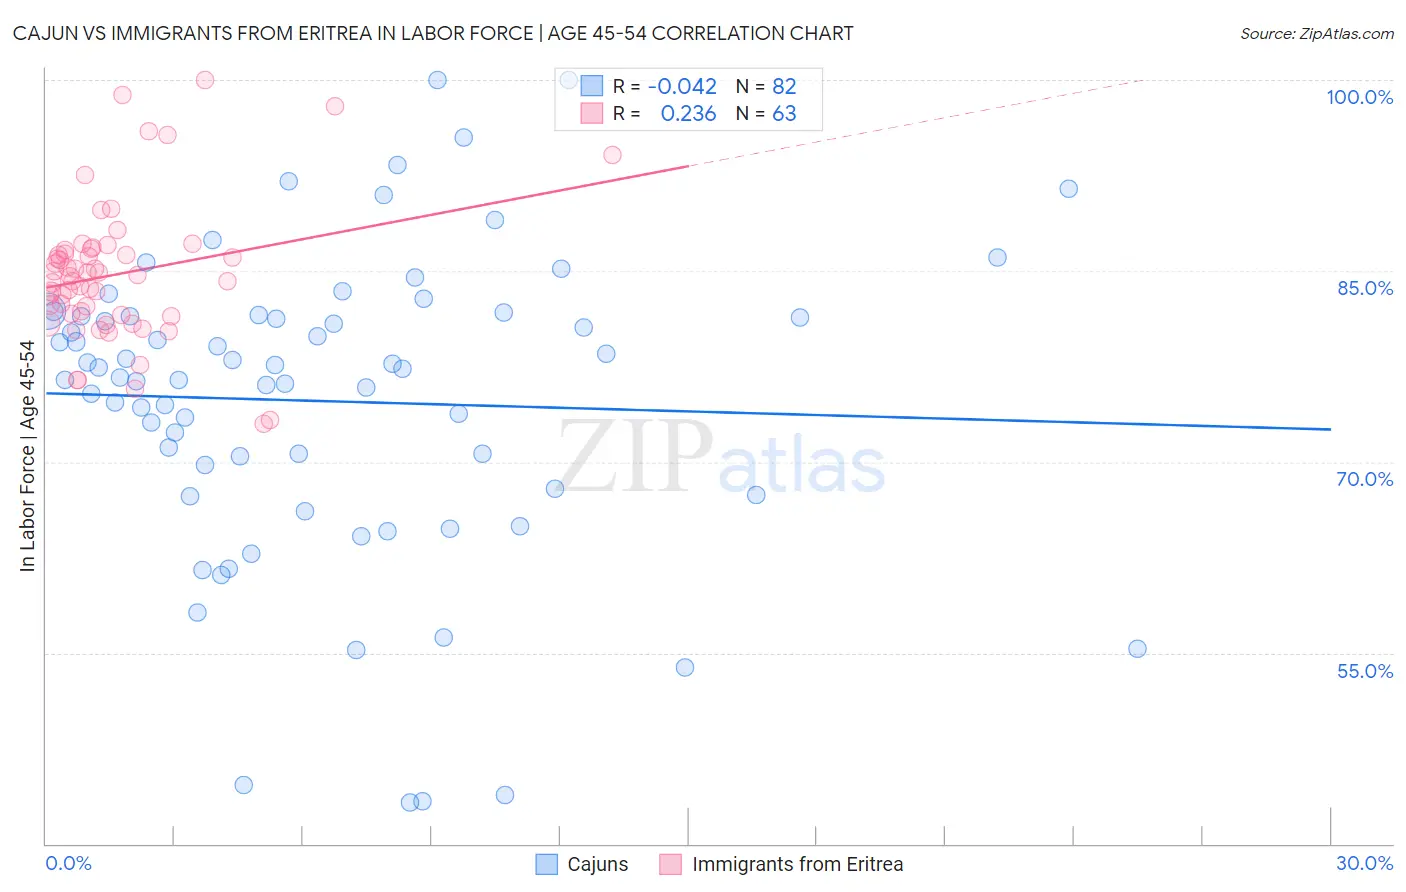
Cajun vs Immigrants from Eritrea In Labor Force | Age 45-54 Correlation Chart
The statistical analysis conducted on geographies consisting of 149,692,418 people shows no correlation between the proportion of Cajuns and labor force participation rate among population between the ages 45 and 54 in the United States with a correlation coefficient (R) of -0.042 and weighted average of 78.1%. Similarly, the statistical analysis conducted on geographies consisting of 104,844,448 people shows a weak positive correlation between the proportion of Immigrants from Eritrea and labor force participation rate among population between the ages 45 and 54 in the United States with a correlation coefficient (R) of 0.236 and weighted average of 83.8%, a difference of 7.3%.
In Labor Force | Age 45-54 Correlation Summary
| Measurement | Cajun | Immigrants from Eritrea |
| Minimum | 43.2% | 73.0% |
| Maximum | 100.0% | 100.0% |
| Range | 56.8% | 27.0% |
| Mean | 74.8% | 84.7% |
| Median | 76.9% | 84.6% |
| Interquartile 25% (IQ1) | 67.9% | 81.5% |
| Interquartile 75% (IQ3) | 81.5% | 86.7% |
| Interquartile Range (IQR) | 13.6% | 5.2% |
| Standard Deviation (Sample) | 12.0% | 5.5% |
| Standard Deviation (Population) | 12.0% | 5.4% |
Similar Demographics by In Labor Force | Age 45-54
Demographics Similar to Cajuns by In Labor Force | Age 45-54
In terms of in labor force | age 45-54, the demographic groups most similar to Cajuns are Seminole (78.1%, a difference of 0.0%), Choctaw (78.2%, a difference of 0.050%), Dutch West Indian (78.2%, a difference of 0.15%), Kiowa (78.3%, a difference of 0.16%), and Sioux (78.0%, a difference of 0.22%).
| Demographics | Rating | Rank | In Labor Force | Age 45-54 |
| Yaqui | 0.0 /100 | #320 | Tragic 78.9% |
| Yup'ik | 0.0 /100 | #321 | Tragic 78.6% |
| Crow | 0.0 /100 | #322 | Tragic 78.3% |
| Kiowa | 0.0 /100 | #323 | Tragic 78.3% |
| Dutch West Indians | 0.0 /100 | #324 | Tragic 78.2% |
| Choctaw | 0.0 /100 | #325 | Tragic 78.2% |
| Seminole | 0.0 /100 | #326 | Tragic 78.1% |
| Cajuns | 0.0 /100 | #327 | Tragic 78.1% |
| Sioux | 0.0 /100 | #328 | Tragic 78.0% |
| Creek | 0.0 /100 | #329 | Tragic 77.7% |
| Cheyenne | 0.0 /100 | #330 | Tragic 77.6% |
| Tsimshian | 0.0 /100 | #331 | Tragic 77.4% |
| Menominee | 0.0 /100 | #332 | Tragic 77.4% |
| Natives/Alaskans | 0.0 /100 | #333 | Tragic 77.1% |
| Apache | 0.0 /100 | #334 | Tragic 77.1% |
Demographics Similar to Immigrants from Eritrea by In Labor Force | Age 45-54
In terms of in labor force | age 45-54, the demographic groups most similar to Immigrants from Eritrea are Immigrants from Bulgaria (83.8%, a difference of 0.020%), Turkish (83.8%, a difference of 0.020%), Latvian (83.8%, a difference of 0.020%), Immigrants from Pakistan (83.8%, a difference of 0.050%), and Immigrants from Lithuania (83.9%, a difference of 0.070%).
| Demographics | Rating | Rank | In Labor Force | Age 45-54 |
| Slovenes | 99.8 /100 | #24 | Exceptional 83.9% |
| Immigrants | North Macedonia | 99.8 /100 | #25 | Exceptional 83.9% |
| Immigrants | Serbia | 99.8 /100 | #26 | Exceptional 83.9% |
| Immigrants | Brazil | 99.8 /100 | #27 | Exceptional 83.9% |
| Immigrants | Lithuania | 99.8 /100 | #28 | Exceptional 83.9% |
| Immigrants | Pakistan | 99.7 /100 | #29 | Exceptional 83.8% |
| Immigrants | Bulgaria | 99.7 /100 | #30 | Exceptional 83.8% |
| Immigrants | Eritrea | 99.7 /100 | #31 | Exceptional 83.8% |
| Turks | 99.7 /100 | #32 | Exceptional 83.8% |
| Latvians | 99.7 /100 | #33 | Exceptional 83.8% |
| Kenyans | 99.5 /100 | #34 | Exceptional 83.7% |
| Brazilians | 99.5 /100 | #35 | Exceptional 83.7% |
| Ugandans | 99.5 /100 | #36 | Exceptional 83.7% |
| Swedes | 99.4 /100 | #37 | Exceptional 83.7% |
| Immigrants | Venezuela | 99.4 /100 | #38 | Exceptional 83.7% |