Bhutanese vs Apache In Labor Force | Age > 16
COMPARE
Bhutanese
Apache
In Labor Force | Age > 16
In Labor Force | Age > 16 Comparison
Bhutanese
Apache
65.5%
IN LABOR FORCE | AGE > 16
86.3/ 100
METRIC RATING
148th/ 347
METRIC RANK
60.7%
IN LABOR FORCE | AGE > 16
0.0/ 100
METRIC RATING
334th/ 347
METRIC RANK
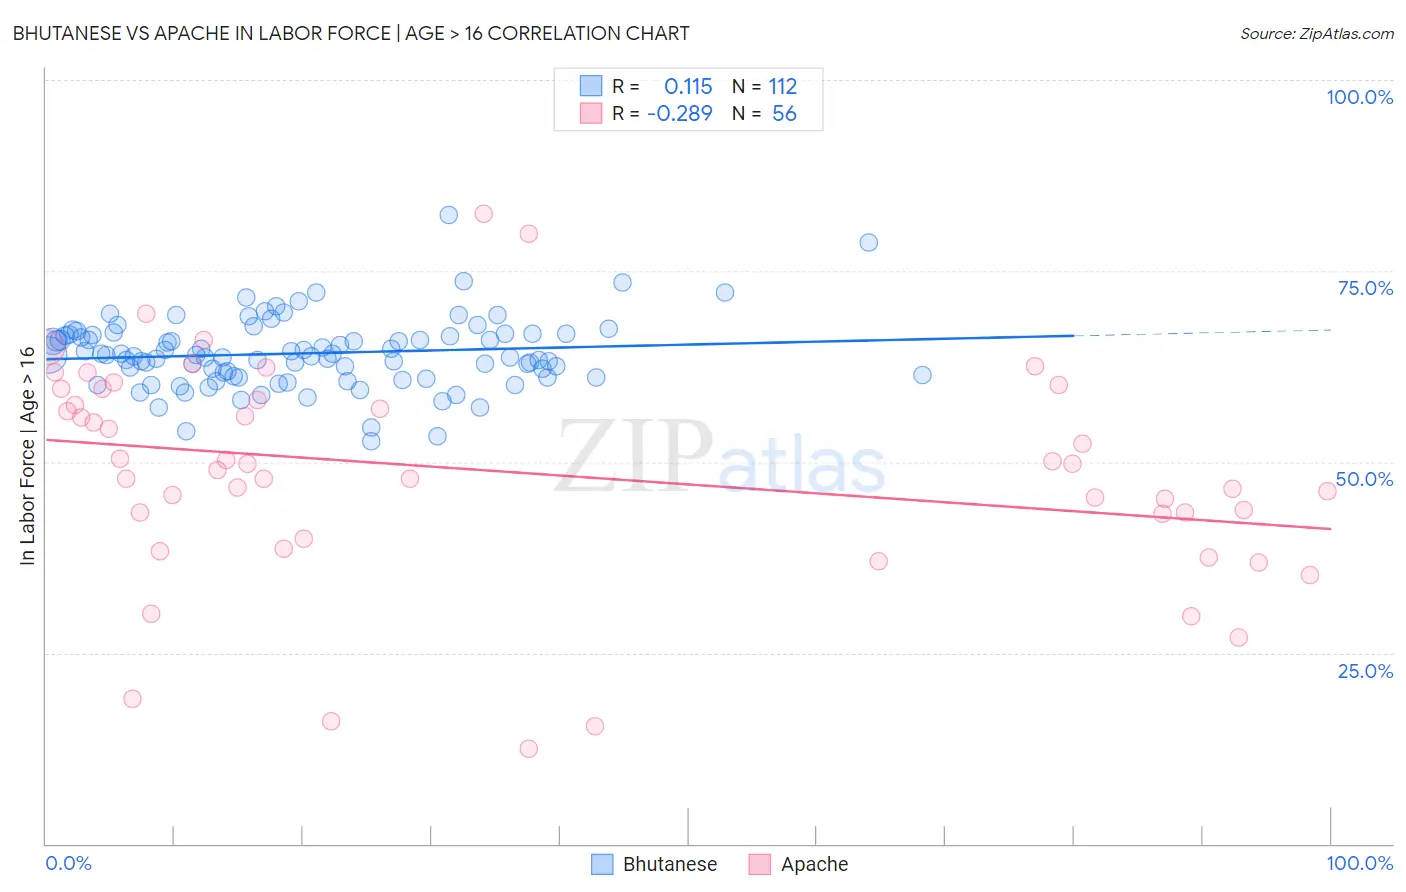
Bhutanese vs Apache In Labor Force | Age > 16 Correlation Chart
The statistical analysis conducted on geographies consisting of 455,605,488 people shows a poor positive correlation between the proportion of Bhutanese and labor force participation rate among population ages 16 and over in the United States with a correlation coefficient (R) of 0.115 and weighted average of 65.5%. Similarly, the statistical analysis conducted on geographies consisting of 231,124,853 people shows a weak negative correlation between the proportion of Apache and labor force participation rate among population ages 16 and over in the United States with a correlation coefficient (R) of -0.289 and weighted average of 60.7%, a difference of 7.8%.
In Labor Force | Age > 16 Correlation Summary
| Measurement | Bhutanese | Apache |
| Minimum | 52.7% | 12.5% |
| Maximum | 82.4% | 82.5% |
| Range | 29.7% | 70.0% |
| Mean | 64.2% | 48.6% |
| Median | 64.0% | 49.3% |
| Interquartile 25% (IQ1) | 61.1% | 41.6% |
| Interquartile 75% (IQ3) | 66.6% | 58.8% |
| Interquartile Range (IQR) | 5.6% | 17.2% |
| Standard Deviation (Sample) | 4.6% | 14.5% |
| Standard Deviation (Population) | 4.6% | 14.4% |
Similar Demographics by In Labor Force | Age > 16
Demographics Similar to Bhutanese by In Labor Force | Age > 16
In terms of in labor force | age > 16, the demographic groups most similar to Bhutanese are Immigrants from Albania (65.4%, a difference of 0.010%), Immigrants from Oceania (65.5%, a difference of 0.030%), Tlingit-Haida (65.5%, a difference of 0.050%), Cypriot (65.5%, a difference of 0.050%), and Immigrants from Romania (65.5%, a difference of 0.060%).
| Demographics | Rating | Rank | In Labor Force | Age > 16 |
| Samoans | 90.5 /100 | #141 | Exceptional 65.5% |
| Indians (Asian) | 89.5 /100 | #142 | Excellent 65.5% |
| Latvians | 89.4 /100 | #143 | Excellent 65.5% |
| Immigrants | Romania | 88.6 /100 | #144 | Excellent 65.5% |
| Tlingit-Haida | 88.3 /100 | #145 | Excellent 65.5% |
| Cypriots | 88.2 /100 | #146 | Excellent 65.5% |
| Immigrants | Oceania | 87.5 /100 | #147 | Excellent 65.5% |
| Bhutanese | 86.3 /100 | #148 | Excellent 65.5% |
| Immigrants | Albania | 85.7 /100 | #149 | Excellent 65.4% |
| Immigrants | Immigrants | 81.9 /100 | #150 | Excellent 65.4% |
| Czechs | 81.5 /100 | #151 | Excellent 65.4% |
| Yugoslavians | 81.3 /100 | #152 | Excellent 65.4% |
| Immigrants | China | 80.5 /100 | #153 | Excellent 65.4% |
| Immigrants | Eastern Europe | 78.3 /100 | #154 | Good 65.4% |
| Immigrants | Armenia | 76.6 /100 | #155 | Good 65.3% |
Demographics Similar to Apache by In Labor Force | Age > 16
In terms of in labor force | age > 16, the demographic groups most similar to Apache are Paiute (60.7%, a difference of 0.050%), Crow (60.8%, a difference of 0.13%), Native/Alaskan (60.6%, a difference of 0.19%), Menominee (60.6%, a difference of 0.21%), and Ute (60.9%, a difference of 0.30%).
| Demographics | Rating | Rank | In Labor Force | Age > 16 |
| Cajuns | 0.0 /100 | #327 | Tragic 61.8% |
| Dutch West Indians | 0.0 /100 | #328 | Tragic 61.7% |
| Choctaw | 0.0 /100 | #329 | Tragic 61.5% |
| Creek | 0.0 /100 | #330 | Tragic 61.3% |
| Ute | 0.0 /100 | #331 | Tragic 60.9% |
| Crow | 0.0 /100 | #332 | Tragic 60.8% |
| Paiute | 0.0 /100 | #333 | Tragic 60.7% |
| Apache | 0.0 /100 | #334 | Tragic 60.7% |
| Natives/Alaskans | 0.0 /100 | #335 | Tragic 60.6% |
| Menominee | 0.0 /100 | #336 | Tragic 60.6% |
| Colville | 0.0 /100 | #337 | Tragic 59.8% |
| Immigrants | Yemen | 0.0 /100 | #338 | Tragic 59.6% |
| Houma | 0.0 /100 | #339 | Tragic 59.5% |
| Pueblo | 0.0 /100 | #340 | Tragic 59.3% |
| Hopi | 0.0 /100 | #341 | Tragic 58.4% |