Austrian vs Chinese In Labor Force | Age 25-29

COMPARE

Austrian
Race
Ancestry
AfghanAfricanAlaska NativeAlaskan AthabascanAlbanianAleutAlsatianAmericanApacheArabArapahoArgentineanArmenianAssyrian/Chaldean/SyriacAustralianAustrianBahamianBangladeshiBarbadianBasqueBelgianBelizeanBermudanBhutaneseBlackfeetBolivianBrazilianBritishBritish West IndianBulgarianBurmeseCajunCambodianCanadianCape VerdeanCarpatho RusynCelticCentral AmericanCentral American IndianCherokeeCheyenneChickasawChileanChippewaChoctawColombianColvilleComancheCosta RicanCreeCreekCroatianCrowCubanCypriotCzechCzechoslovakianDanishDelawareDominicanDutchDutch West IndianEastern EuropeanEcuadorianEgyptianEnglishEstonianEthiopianEuropeanFijianFilipinoFinnishFrenchFrench American IndianFrench CanadianGermanGerman RussianGhanaianGreekGuamanian/ChamorroGuatemalanGuyaneseHaitianHmongHonduranHopiHoumaHungarianIcelanderIndian (Asian)IndonesianInupiatIranianIraqiIrishIroquoisIsraeliItalianJamaicanJapaneseJordanianKenyanKiowaKoreanLaotianLatvianLebaneseLiberianLithuanianLumbeeLuxembourgerMacedonianMalaysianMalteseMarshalleseMenomineeMexicanMexican American IndianMongolianMoroccanNative HawaiianNavajoNepaleseNew ZealanderNicaraguanNigerianNorthern EuropeanNorwegianOkinawanOsageOttawaPaiutePakistaniPalestinianPanamanianParaguayanPennsylvania GermanPeruvianPimaPolishPortuguesePotawatomiPuebloPuerto RicanPuget Sound SalishRomanianRussianSalvadoranSamoanScandinavianScotch-IrishScottishSeminoleSenegaleseSerbianShoshoneSierra LeoneanSiouxSlavicSlovakSloveneSomaliSouth AfricanSouth AmericanSouth American IndianSoviet UnionSpaniardSpanishSpanish AmericanSpanish American IndianSri LankanSubsaharan AfricanSudaneseSwedishSwissSyrianTaiwaneseThaiTlingit-HaidaTohono O'OdhamTonganTrinidadian and TobagonianTsimshianTurkishU.S. Virgin IslanderUgandanUkrainianUruguayanUteVenezuelanVietnameseWelshWest IndianYakamaYaquiYugoslavianYumanYup'ikZimbabwean
Immigration
NonimmigrantsImmigrantsAfghanistanAfricaAlbaniaArgentinaArmeniaAsiaAustraliaAustriaBahamasBangladeshBarbadosBelarusBelgiumBelizeBoliviaBosnia and HerzegovinaBrazilBulgariaBurma/MyanmarCabo VerdeCambodiaCameroonCanadaCaribbeanCentral AmericaChileChinaColombiaCongoCosta RicaCroatiaCubaCzechoslovakiaDenmarkDominicaDominican RepublicEastern AfricaEastern AsiaEastern EuropeEcuadorEgyptEl SalvadorEnglandEritreaEthiopiaEuropeFijiFranceGermanyGhanaGreeceGrenadaGuatemalaGuyanaHaitiHondurasHong KongHungaryIndiaIndonesiaIranIraqIrelandIsraelItalyJamaicaJapanJordanKazakhstanKenyaKoreaKuwaitLaosLatin AmericaLatviaLebanonLiberiaLithuaniaMalaysiaMexicoMicronesiaMiddle AfricaMoldovaMoroccoNepalNetherlandsNicaraguaNigeriaNorth AmericaNorth MacedoniaNorthern AfricaNorthern EuropeNorwayOceaniaPakistanPanamaPeruPhilippinesPolandPortugalRomaniaRussiaSaudi ArabiaScotlandSenegalSerbiaSierra LeoneSingaporeSomaliaSouth AfricaSouth AmericaSouth Central AsiaSouth Eastern AsiaSouthern EuropeSpainSri LankaSt. Vincent and the GrenadinesSudanSwedenSwitzerlandSyriaTaiwanThailandTrinidad and TobagoTurkeyUgandaUkraineUruguayUzbekistanVenezuelaVietnamWest IndiesWestern AfricaWestern AsiaWestern EuropeYemenZaireZimbabweAzores
Chinese
Race
Ancestry
AfghanAfricanAlaska NativeAlaskan AthabascanAlbanianAleutAlsatianAmericanApacheArabArapahoArgentineanArmenianAssyrian/Chaldean/SyriacAustralianBahamianBangladeshiBarbadianBasqueBelgianBelizeanBermudanBhutaneseBlackfeetBolivianBrazilianBritishBritish West IndianBulgarianBurmeseCajunCambodianCanadianCape VerdeanCarpatho RusynCelticCentral AmericanCentral American IndianCherokeeCheyenneChickasawChileanChineseChippewaChoctawColombianColvilleComancheCosta RicanCreeCreekCroatianCrowCubanCypriotCzechCzechoslovakianDanishDelawareDominicanDutchDutch West IndianEastern EuropeanEcuadorianEgyptianEnglishEstonianEthiopianEuropeanFijianFilipinoFinnishFrenchFrench American IndianFrench CanadianGermanGerman RussianGhanaianGreekGuamanian/ChamorroGuatemalanGuyaneseHaitianHmongHonduranHopiHoumaHungarianIcelanderIndian (Asian)IndonesianInupiatIranianIraqiIrishIroquoisIsraeliItalianJamaicanJapaneseJordanianKenyanKiowaKoreanLaotianLatvianLebaneseLiberianLithuanianLumbeeLuxembourgerMacedonianMalaysianMalteseMarshalleseMenomineeMexicanMexican American IndianMongolianMoroccanNative HawaiianNavajoNepaleseNew ZealanderNicaraguanNigerianNorthern EuropeanNorwegianOkinawanOsageOttawaPaiutePakistaniPalestinianPanamanianParaguayanPennsylvania GermanPeruvianPimaPolishPortuguesePotawatomiPuebloPuerto RicanPuget Sound SalishRomanianRussianSalvadoranSamoanScandinavianScotch-IrishScottishSeminoleSenegaleseSerbianShoshoneSierra LeoneanSiouxSlavicSlovakSloveneSomaliSouth AfricanSouth AmericanSouth American IndianSoviet UnionSpaniardSpanishSpanish AmericanSpanish American IndianSri LankanSubsaharan AfricanSudaneseSwedishSwissSyrianTaiwaneseThaiTlingit-HaidaTohono O'OdhamTonganTrinidadian and TobagonianTsimshianTurkishU.S. Virgin IslanderUgandanUkrainianUruguayanUteVenezuelanVietnameseWelshWest IndianYakamaYaquiYugoslavianYumanYup'ikZimbabwean
Immigration
NonimmigrantsImmigrantsAfghanistanAfricaAlbaniaArgentinaArmeniaAsiaAustraliaAustriaBahamasBangladeshBarbadosBelarusBelgiumBelizeBoliviaBosnia and HerzegovinaBrazilBulgariaBurma/MyanmarCabo VerdeCambodiaCameroonCanadaCaribbeanCentral AmericaChileChinaColombiaCongoCosta RicaCroatiaCubaCzechoslovakiaDenmarkDominicaDominican RepublicEastern AfricaEastern AsiaEastern EuropeEcuadorEgyptEl SalvadorEnglandEritreaEthiopiaEuropeFijiFranceGermanyGhanaGreeceGrenadaGuatemalaGuyanaHaitiHondurasHong KongHungaryIndiaIndonesiaIranIraqIrelandIsraelItalyJamaicaJapanJordanKazakhstanKenyaKoreaKuwaitLaosLatin AmericaLatviaLebanonLiberiaLithuaniaMalaysiaMexicoMicronesiaMiddle AfricaMoldovaMoroccoNepalNetherlandsNicaraguaNigeriaNorth AmericaNorth MacedoniaNorthern AfricaNorthern EuropeNorwayOceaniaPakistanPanamaPeruPhilippinesPolandPortugalRomaniaRussiaSaudi ArabiaScotlandSenegalSerbiaSierra LeoneSingaporeSomaliaSouth AfricaSouth AmericaSouth Central AsiaSouth Eastern AsiaSouthern EuropeSpainSri LankaSt. Vincent and the GrenadinesSudanSwedenSwitzerlandSyriaTaiwanThailandTrinidad and TobagoTurkeyUgandaUkraineUruguayUzbekistanVenezuelaVietnamWest IndiesWestern AfricaWestern AsiaWestern EuropeYemenZaireZimbabweAzores
In Labor Force | Age 25-29
Income
Poverty
Unemployment
Labor Participation
Family Structure
Vehicle Availability
Education Level
Disability

In Labor Force | Age 25-29 Comparison

Austrians

Chinese

Exceptional
Poor
85.1%
IN LABOR FORCE | AGE 25-29
95.3/ 100
METRIC RATING
93rd/ 347
METRIC RANK
84.3%
IN LABOR FORCE | AGE 25-29
12.7/ 100
METRIC RATING
210th/ 347
METRIC RANK

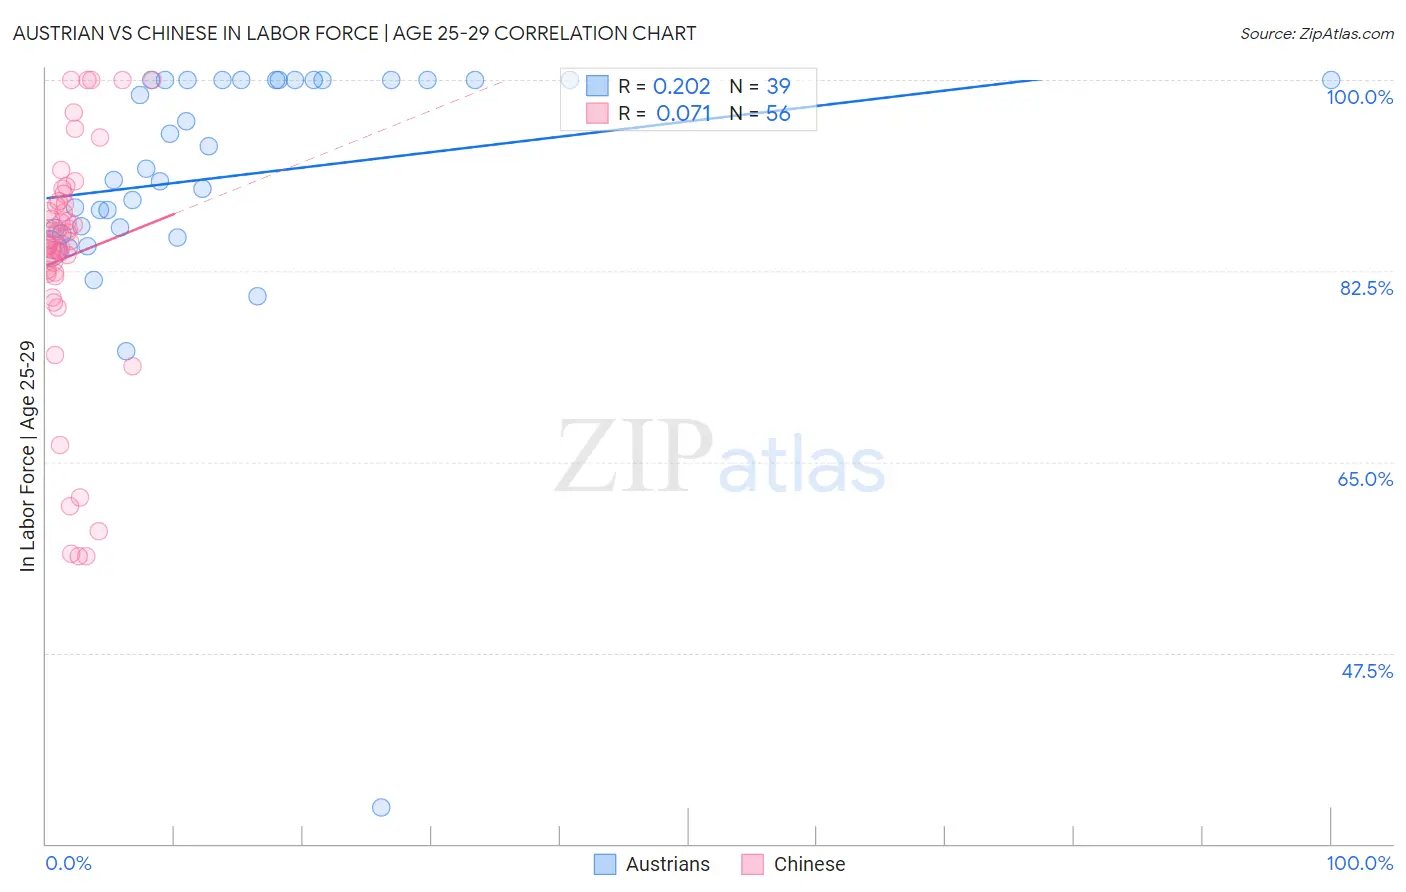
Austrian vs Chinese In Labor Force | Age 25-29 Correlation Chart

The statistical analysis conducted on geographies consisting of 451,766,643 people shows a weak positive correlation between the proportion of Austrians and labor force participation rate among population between the ages 25 and 29 in the United States with a correlation coefficient (R) of 0.202 and weighted average of 85.1%. Similarly, the statistical analysis conducted on geographies consisting of 64,804,747 people shows a slight positive correlation between the proportion of Chinese and labor force participation rate among population between the ages 25 and 29 in the United States with a correlation coefficient (R) of 0.071 and weighted average of 84.3%, a difference of 0.91%.
Austrian vs Chinese In Labor Force | Age 25-29

In Labor Force | Age 25-29 Correlation Summary

MeasurementAustrianChinese
Minimum33.3%56.3%
Maximum100.0%100.0%
Range66.7%43.7%
Mean91.2%83.8%
Median91.8%85.3%
Interquartile 25% (IQ1)86.4%82.3%
Interquartile 75% (IQ3)100.0%88.8%
Interquartile Range (IQR)13.6%6.5%
Standard Deviation (Sample)11.9%10.9%
Standard Deviation (Population)11.7%10.8%

Similar Demographics by In Labor Force | Age 25-29

Demographics Similar to Austrians by In Labor Force | Age 25-29

In terms of in labor force | age 25-29, the demographic groups most similar to Austrians are Immigrants from Costa Rica (85.1%, a difference of 0.010%), Immigrants from Moldova (85.1%, a difference of 0.020%), Immigrants from Korea (85.1%, a difference of 0.020%), Burmese (85.1%, a difference of 0.030%), and Immigrants from Netherlands (85.1%, a difference of 0.030%).
DemographicsRating | RankIn Labor Force | Age 25-29
Ukrainians
96.7
/100
|
#86
Exceptional
85.2%
French Canadians
96.5
/100
|
#87
Exceptional
85.2%
Immigrants | Croatia
96.4
/100
|
#88
Exceptional
85.2%
Immigrants | France
96.3
/100
|
#89
Exceptional
85.2%
Burmese
95.9
/100
|
#90
Exceptional
85.1%
Immigrants | Moldova
95.8
/100
|
#91
Exceptional
85.1%
Immigrants | Costa Rica
95.5
/100
|
#92
Exceptional
85.1%
Austrians
95.3
/100
|
#93
Exceptional
85.1%
Immigrants | Korea
94.8
/100
|
#94
Exceptional
85.1%
Immigrants | Netherlands
94.6
/100
|
#95
Exceptional
85.1%
Immigrants | Romania
94.6
/100
|
#96
Exceptional
85.1%
Immigrants | Sudan
94.3
/100
|
#97
Exceptional
85.1%
Mongolians
94.1
/100
|
#98
Exceptional
85.1%
Bangladeshis
94.0
/100
|
#99
Exceptional
85.1%
Immigrants | Switzerland
93.9
/100
|
#100
Exceptional
85.1%

Demographics Similar to Chinese by In Labor Force | Age 25-29

In terms of in labor force | age 25-29, the demographic groups most similar to Chinese are Immigrants from Jordan (84.4%, a difference of 0.0%), Immigrants from Venezuela (84.3%, a difference of 0.0%), Immigrants from Armenia (84.4%, a difference of 0.010%), Immigrants from Indonesia (84.4%, a difference of 0.010%), and Subsaharan African (84.3%, a difference of 0.020%).
DemographicsRating | RankIn Labor Force | Age 25-29
Immigrants | Afghanistan
15.6
/100
|
#203
Poor
84.4%
Venezuelans
15.1
/100
|
#204
Poor
84.4%
Ecuadorians
14.8
/100
|
#205
Poor
84.4%
Immigrants | Cambodia
14.3
/100
|
#206
Poor
84.4%
Immigrants | Armenia
13.3
/100
|
#207
Poor
84.4%
Immigrants | Indonesia
13.2
/100
|
#208
Poor
84.4%
Immigrants | Jordan
12.8
/100
|
#209
Poor
84.4%
Chinese
12.7
/100
|
#210
Poor
84.3%
Immigrants | Venezuela
12.6
/100
|
#211
Poor
84.3%
Sub-Saharan Africans
11.7
/100
|
#212
Poor
84.3%
Japanese
11.4
/100
|
#213
Poor
84.3%
Lebanese
11.1
/100
|
#214
Poor
84.3%
Immigrants | Syria
10.7
/100
|
#215
Poor
84.3%
Israelis
9.3
/100
|
#216
Tragic
84.3%
Immigrants | Ecuador
9.3
/100
|
#217
Tragic
84.3%