American vs White/Caucasian In Labor Force | Age 16-19
COMPARE
American
White/Caucasian
In Labor Force | Age 16-19
In Labor Force | Age 16-19 Comparison
Americans
Whites/Caucasians
40.3%
IN LABOR FORCE | AGE 16-19
100.0/ 100
METRIC RATING
61st/ 347
METRIC RANK
41.3%
IN LABOR FORCE | AGE 16-19
100.0/ 100
METRIC RATING
42nd/ 347
METRIC RANK
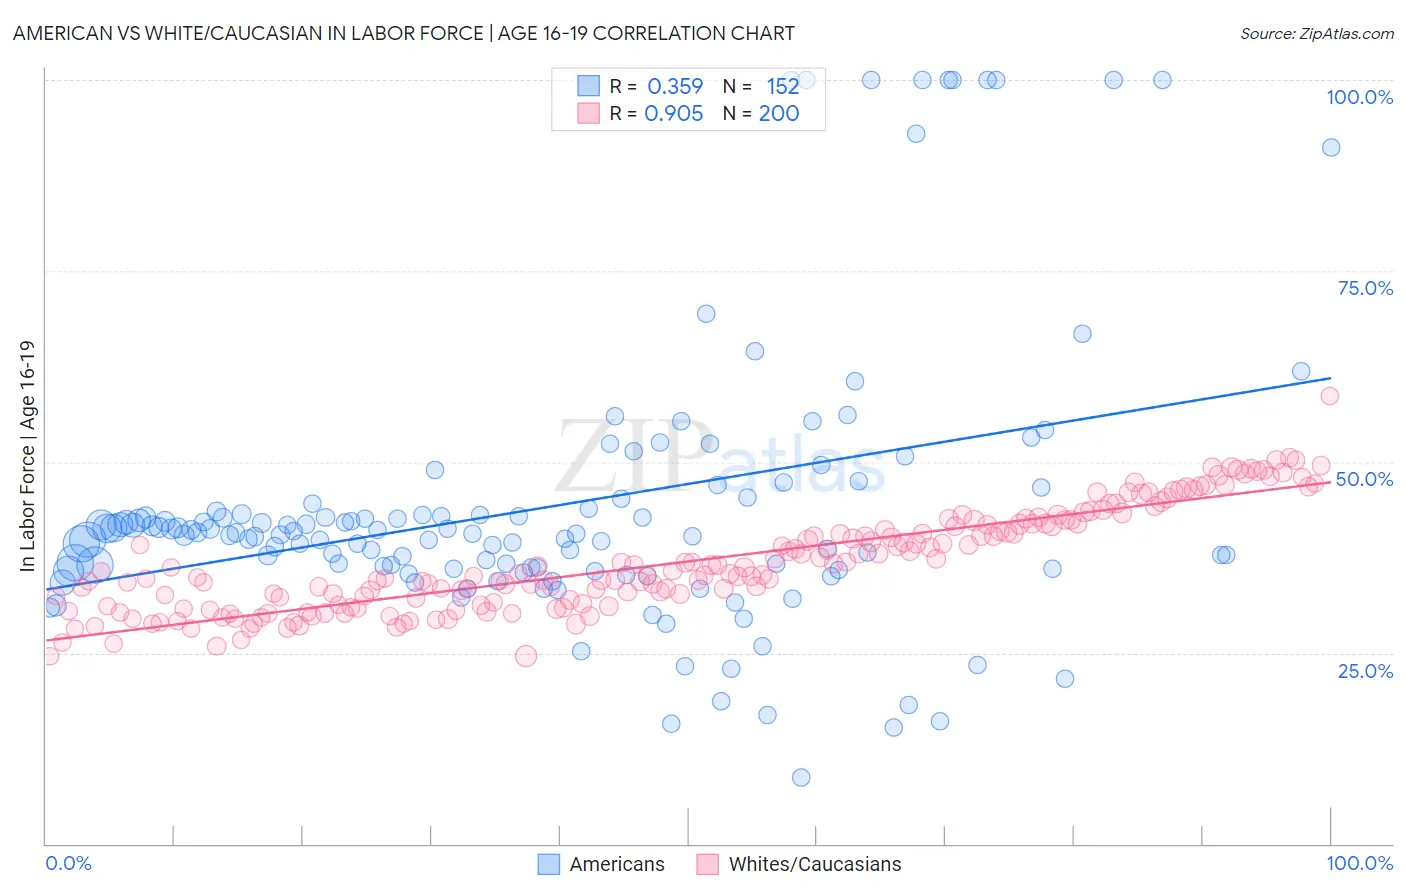
American vs White/Caucasian In Labor Force | Age 16-19 Correlation Chart
The statistical analysis conducted on geographies consisting of 576,408,281 people shows a mild positive correlation between the proportion of Americans and labor force participation rate among population between the ages 16 and 19 in the United States with a correlation coefficient (R) of 0.359 and weighted average of 40.3%. Similarly, the statistical analysis conducted on geographies consisting of 578,396,700 people shows a near-perfect positive correlation between the proportion of Whites/Caucasians and labor force participation rate among population between the ages 16 and 19 in the United States with a correlation coefficient (R) of 0.905 and weighted average of 41.3%, a difference of 2.5%.
In Labor Force | Age 16-19 Correlation Summary
| Measurement | American | White/Caucasian |
| Minimum | 8.6% | 24.5% |
| Maximum | 100.0% | 58.6% |
| Range | 91.4% | 34.1% |
| Mean | 44.1% | 37.0% |
| Median | 40.6% | 35.4% |
| Interquartile 25% (IQ1) | 36.0% | 31.4% |
| Interquartile 75% (IQ3) | 43.6% | 41.8% |
| Interquartile Range (IQR) | 7.6% | 10.5% |
| Standard Deviation (Sample) | 18.5% | 6.6% |
| Standard Deviation (Population) | 18.5% | 6.6% |
Demographics Similar to Americans and Whites/Caucasians by In Labor Force | Age 16-19
In terms of in labor force | age 16-19, the demographic groups most similar to Americans are Immigrants from Eastern Africa (40.4%, a difference of 0.15%), Slavic (40.4%, a difference of 0.19%), Aleut (40.4%, a difference of 0.33%), Lithuanian (40.4%, a difference of 0.34%), and Fijian (40.4%, a difference of 0.36%). Similarly, the demographic groups most similar to Whites/Caucasians are Celtic (41.3%, a difference of 0.010%), Tongan (41.2%, a difference of 0.30%), European (41.1%, a difference of 0.41%), Croatian (41.1%, a difference of 0.45%), and Immigrants from Sudan (41.0%, a difference of 0.77%).
| Demographics | Rating | Rank | In Labor Force | Age 16-19 |
| Celtics | 100.0 /100 | #41 | Exceptional 41.3% |
| Whites/Caucasians | 100.0 /100 | #42 | Exceptional 41.3% |
| Tongans | 100.0 /100 | #43 | Exceptional 41.2% |
| Europeans | 100.0 /100 | #44 | Exceptional 41.1% |
| Croatians | 100.0 /100 | #45 | Exceptional 41.1% |
| Immigrants | Sudan | 100.0 /100 | #46 | Exceptional 41.0% |
| Carpatho Rusyns | 100.0 /100 | #47 | Exceptional 40.8% |
| Icelanders | 100.0 /100 | #48 | Exceptional 40.8% |
| Cree | 100.0 /100 | #49 | Exceptional 40.8% |
| Indonesians | 100.0 /100 | #50 | Exceptional 40.7% |
| Immigrants | Zaire | 100.0 /100 | #51 | Exceptional 40.7% |
| Immigrants | Laos | 100.0 /100 | #52 | Exceptional 40.6% |
| Immigrants | Kenya | 100.0 /100 | #53 | Exceptional 40.5% |
| Tlingit-Haida | 100.0 /100 | #54 | Exceptional 40.5% |
| British | 100.0 /100 | #55 | Exceptional 40.5% |
| Fijians | 100.0 /100 | #56 | Exceptional 40.4% |
| Lithuanians | 100.0 /100 | #57 | Exceptional 40.4% |
| Aleuts | 100.0 /100 | #58 | Exceptional 40.4% |
| Slavs | 100.0 /100 | #59 | Exceptional 40.4% |
| Immigrants | Eastern Africa | 100.0 /100 | #60 | Exceptional 40.4% |
| Americans | 100.0 /100 | #61 | Exceptional 40.3% |