American vs Houma In Labor Force | Age 16-19
COMPARE
American
Houma
In Labor Force | Age 16-19
In Labor Force | Age 16-19 Comparison
Americans
Houma
40.3%
IN LABOR FORCE | AGE 16-19
100.0/ 100
METRIC RATING
61st/ 347
METRIC RANK
35.6%
IN LABOR FORCE | AGE 16-19
11.0/ 100
METRIC RATING
212th/ 347
METRIC RANK
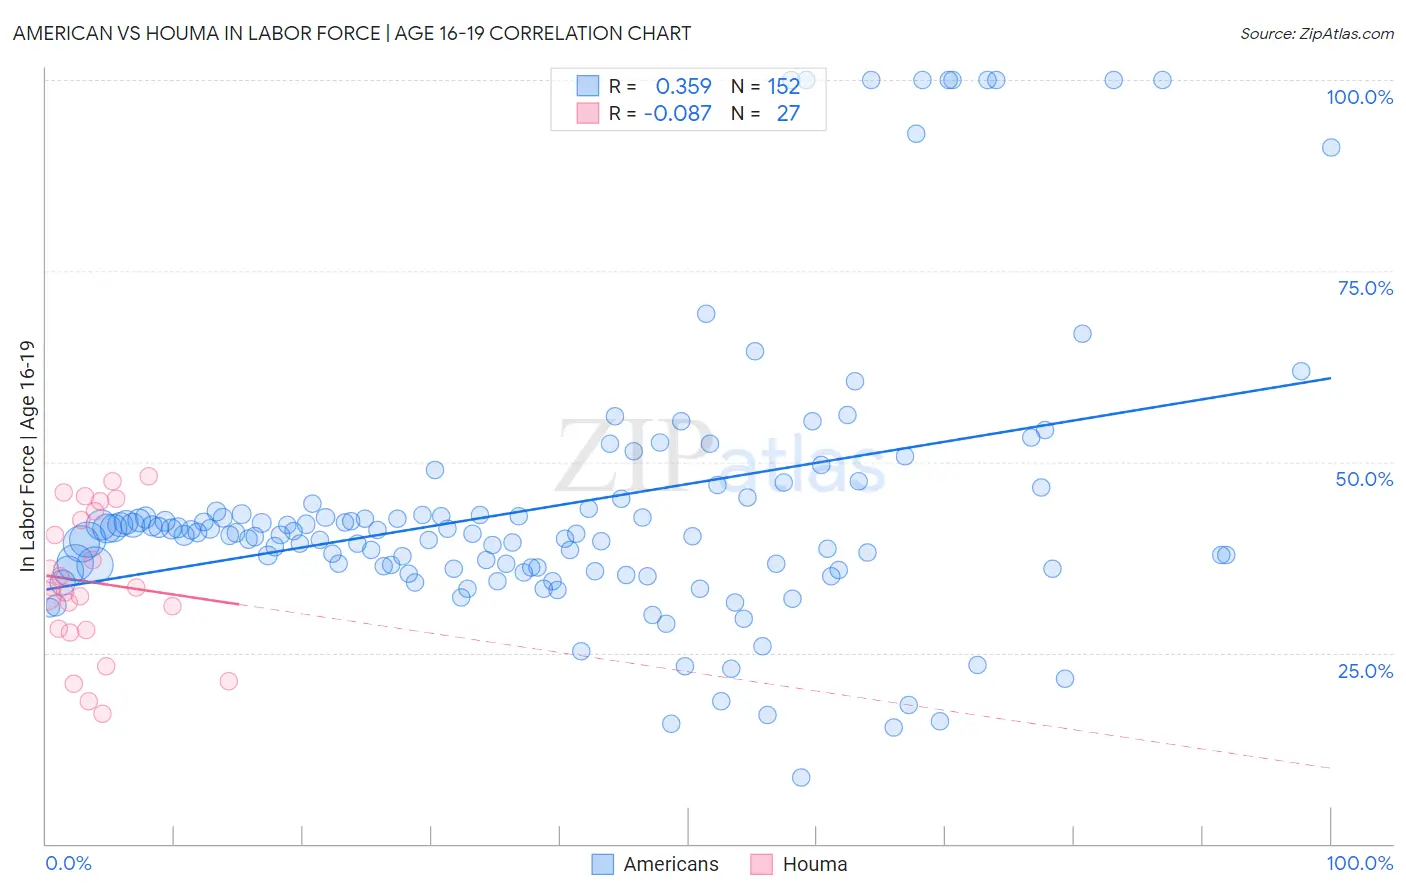
American vs Houma In Labor Force | Age 16-19 Correlation Chart
The statistical analysis conducted on geographies consisting of 576,408,281 people shows a mild positive correlation between the proportion of Americans and labor force participation rate among population between the ages 16 and 19 in the United States with a correlation coefficient (R) of 0.359 and weighted average of 40.3%. Similarly, the statistical analysis conducted on geographies consisting of 36,777,014 people shows a slight negative correlation between the proportion of Houma and labor force participation rate among population between the ages 16 and 19 in the United States with a correlation coefficient (R) of -0.087 and weighted average of 35.6%, a difference of 13.2%.
In Labor Force | Age 16-19 Correlation Summary
| Measurement | American | Houma |
| Minimum | 8.6% | 17.1% |
| Maximum | 100.0% | 48.1% |
| Range | 91.4% | 31.0% |
| Mean | 44.1% | 34.2% |
| Median | 40.6% | 33.5% |
| Interquartile 25% (IQ1) | 36.0% | 28.0% |
| Interquartile 75% (IQ3) | 43.6% | 43.6% |
| Interquartile Range (IQR) | 7.6% | 15.6% |
| Standard Deviation (Sample) | 18.5% | 9.2% |
| Standard Deviation (Population) | 18.5% | 9.1% |
Similar Demographics by In Labor Force | Age 16-19
Demographics Similar to Americans by In Labor Force | Age 16-19
In terms of in labor force | age 16-19, the demographic groups most similar to Americans are Cherokee (40.2%, a difference of 0.14%), Immigrants from Eastern Africa (40.4%, a difference of 0.15%), Slavic (40.4%, a difference of 0.19%), Northern European (40.2%, a difference of 0.20%), and Immigrants from Micronesia (40.2%, a difference of 0.31%).
| Demographics | Rating | Rank | In Labor Force | Age 16-19 |
| Tlingit-Haida | 100.0 /100 | #54 | Exceptional 40.5% |
| British | 100.0 /100 | #55 | Exceptional 40.5% |
| Fijians | 100.0 /100 | #56 | Exceptional 40.4% |
| Lithuanians | 100.0 /100 | #57 | Exceptional 40.4% |
| Aleuts | 100.0 /100 | #58 | Exceptional 40.4% |
| Slavs | 100.0 /100 | #59 | Exceptional 40.4% |
| Immigrants | Eastern Africa | 100.0 /100 | #60 | Exceptional 40.4% |
| Americans | 100.0 /100 | #61 | Exceptional 40.3% |
| Cherokee | 100.0 /100 | #62 | Exceptional 40.2% |
| Northern Europeans | 100.0 /100 | #63 | Exceptional 40.2% |
| Immigrants | Micronesia | 100.0 /100 | #64 | Exceptional 40.2% |
| Kenyans | 100.0 /100 | #65 | Exceptional 40.1% |
| Immigrants | Nonimmigrants | 100.0 /100 | #66 | Exceptional 40.1% |
| Canadians | 100.0 /100 | #67 | Exceptional 40.1% |
| Italians | 99.9 /100 | #68 | Exceptional 40.1% |
Demographics Similar to Houma by In Labor Force | Age 16-19
In terms of in labor force | age 16-19, the demographic groups most similar to Houma are Immigrants from Bolivia (35.6%, a difference of 0.0%), Apache (35.6%, a difference of 0.010%), Immigrants from South Eastern Asia (35.6%, a difference of 0.030%), Dutch West Indian (35.6%, a difference of 0.050%), and Immigrants from Costa Rica (35.6%, a difference of 0.050%).
| Demographics | Rating | Rank | In Labor Force | Age 16-19 |
| South American Indians | 14.6 /100 | #205 | Poor 35.8% |
| Chileans | 14.6 /100 | #206 | Poor 35.8% |
| Immigrants | Eastern Europe | 14.5 /100 | #207 | Poor 35.8% |
| Koreans | 13.3 /100 | #208 | Poor 35.7% |
| Moroccans | 12.7 /100 | #209 | Poor 35.7% |
| Immigrants | Switzerland | 11.9 /100 | #210 | Poor 35.6% |
| Mexicans | 11.9 /100 | #211 | Poor 35.6% |
| Houma | 11.0 /100 | #212 | Poor 35.6% |
| Immigrants | Bolivia | 11.0 /100 | #213 | Poor 35.6% |
| Apache | 11.0 /100 | #214 | Poor 35.6% |
| Immigrants | South Eastern Asia | 10.8 /100 | #215 | Poor 35.6% |
| Dutch West Indians | 10.7 /100 | #216 | Poor 35.6% |
| Immigrants | Costa Rica | 10.7 /100 | #217 | Poor 35.6% |
| Sri Lankans | 9.8 /100 | #218 | Tragic 35.5% |
| Guatemalans | 8.6 /100 | #219 | Tragic 35.5% |