Zip Codes with the Highest Percentage of Households with Income Above $100,000 in Metairie, LA
RELATED REPORTS & OPTIONS
Household Income | $100k+
Metairie
Compare Zip Codes
Map of Zip Codes with the Highest Percentage of Households with Income Above $100,000 in Metairie
32.5%
42.1%
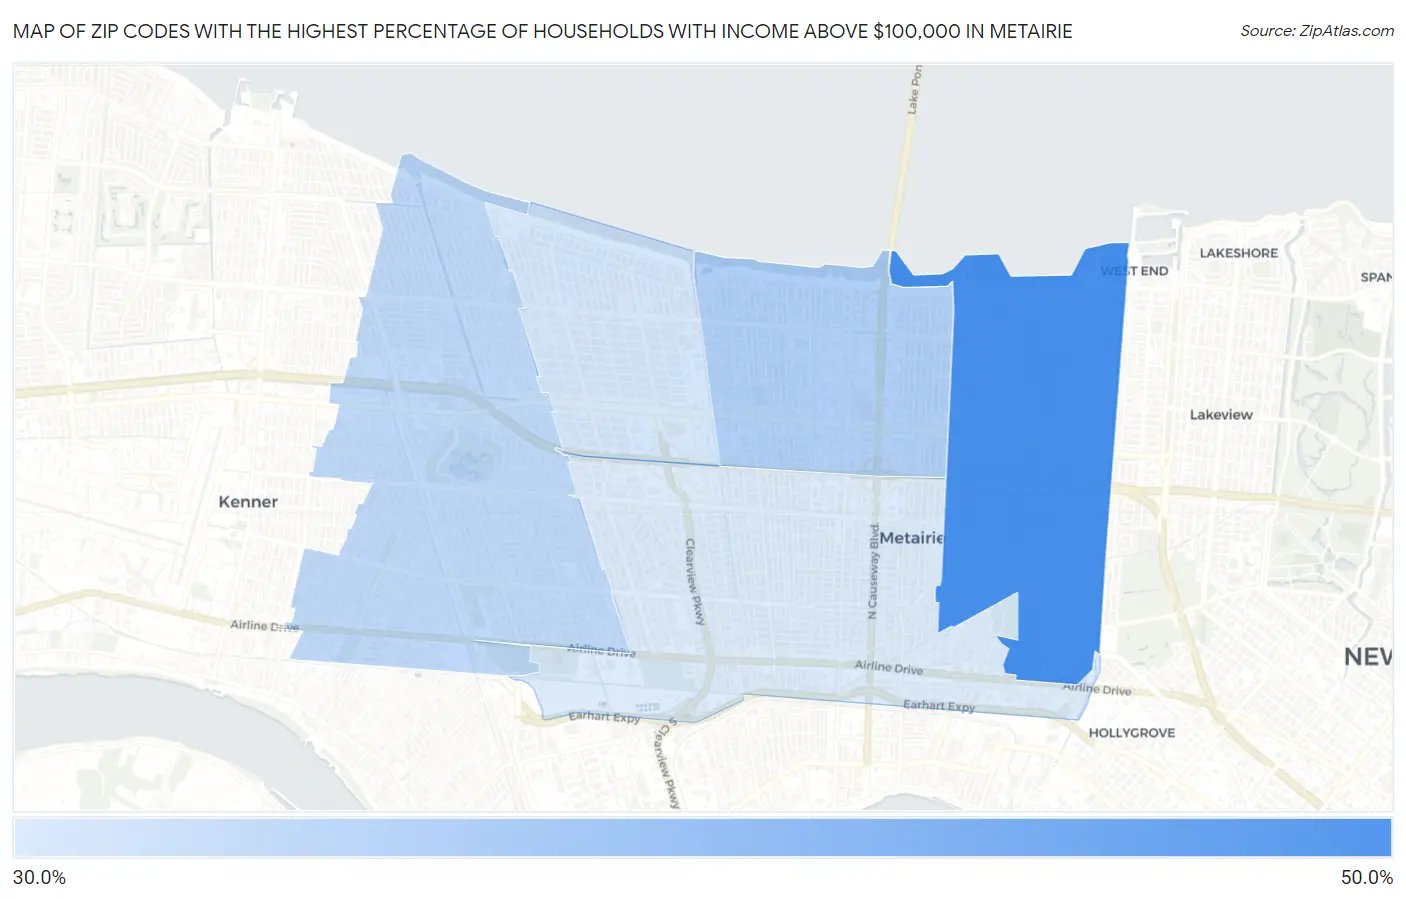
Zip Codes with the Highest Percentage of Households with Income Above $100,000 in Metairie, LA
| Zip Code | Households with Income > $100k | vs State | vs National | |
| 1. | 70005 | 42.1% | 28.2%(+13.9)#62 | 37.3%(+4.80)#7,845 |
| 2. | 70002 | 35.2% | 28.2%(+7.00)#103 | 37.3%(-2.10)#11,655 |
| 3. | 70003 | 34.4% | 28.2%(+6.20)#107 | 37.3%(-2.90)#12,135 |
| 4. | 70006 | 32.9% | 28.2%(+4.70)#117 | 37.3%(-4.40)#13,199 |
| 5. | 70001 | 32.5% | 28.2%(+4.30)#120 | 37.3%(-4.80)#13,448 |
1
Common Questions
What are the Top 3 Zip Codes with the Highest Percentage of Households with Income Above $100,000 in Metairie, LA?
Top 3 Zip Codes with the Highest Percentage of Households with Income Above $100,000 in Metairie, LA are:
What zip code has the Highest Percentage of Households with Income Above $100,000 in Metairie, LA?
70005 has the Highest Percentage of Households with Income Above $100,000 in Metairie, LA with 42.1%.
What is the Percentage of Households with Income Above $100,000 in Metairie, LA?
Percentage of Households with Income Above $100,000 in Metairie is 35.3%.
What is the Percentage of Households with Income Above $100,000 in Louisiana?
Percentage of Households with Income Above $100,000 in Louisiana is 28.2%.
What is the Percentage of Households with Income Above $100,000 in the United States?
Percentage of Households with Income Above $100,000 in the United States is 37.3%.