Zip Codes with the Highest Percentage of Population Employed in Architecture & Engineering in Houma, LA
RELATED REPORTS & OPTIONS
Architecture & Engineering
Houma
Compare Zip Codes
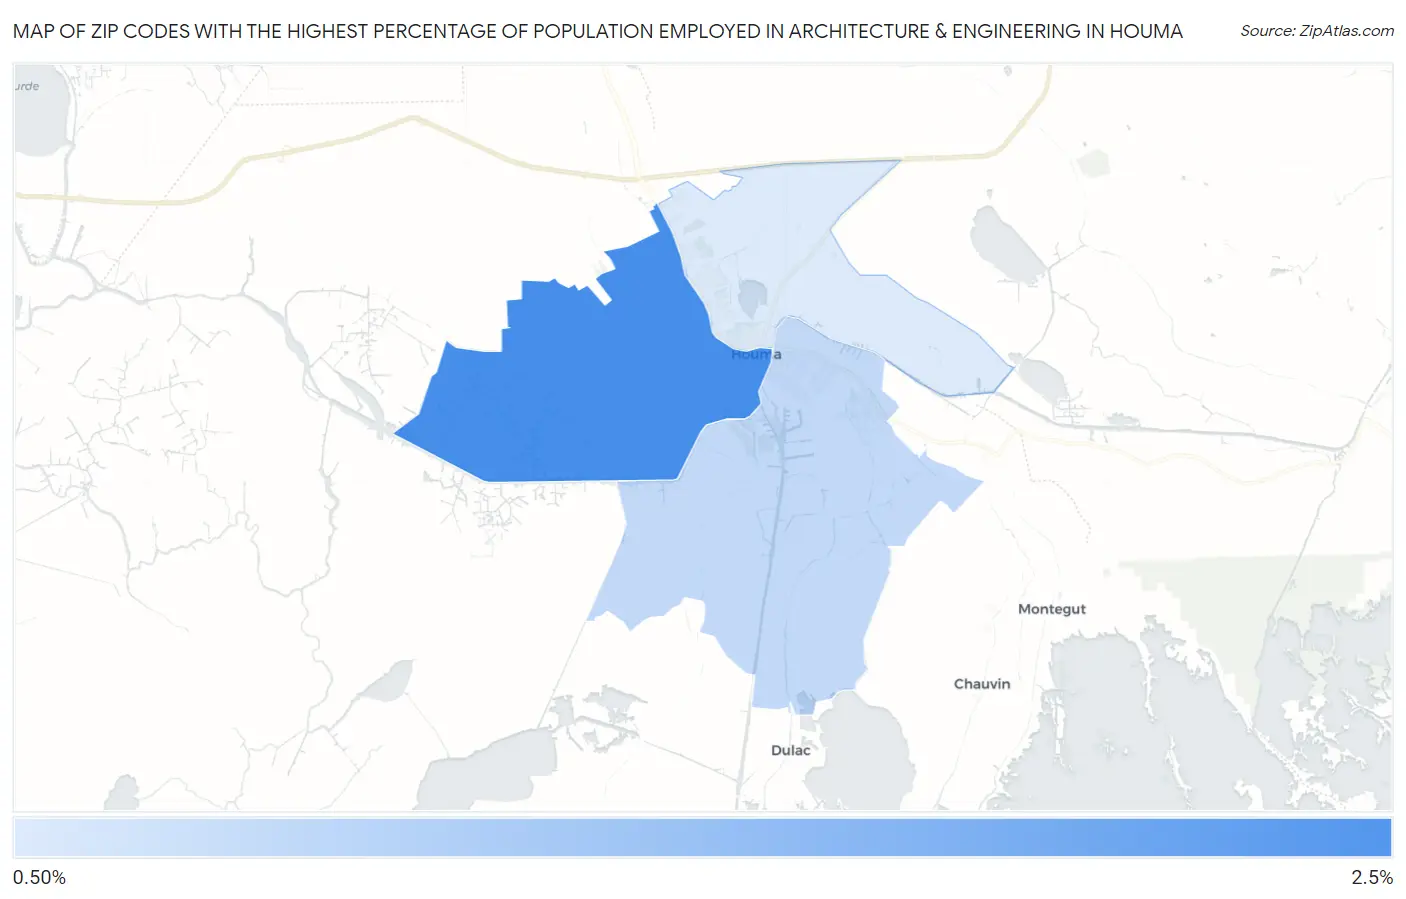
Map of Zip Codes with the Highest Percentage of Population Employed in Architecture & Engineering in Houma
0.52%
2.4%
Zip Codes with the Highest Percentage of Population Employed in Architecture & Engineering in Houma, LA
| Zip Code | % Employed | vs State | vs National | |
| 1. | 70360 | 2.4% | 1.9%(+0.497)#99 | 2.1%(+0.289)#7,293 |
| 2. | 70363 | 0.86% | 1.9%(-1.08)#234 | 2.1%(-1.29)#17,648 |
| 3. | 70364 | 0.52% | 1.9%(-1.42)#270 | 2.1%(-1.63)#20,152 |
1
Common Questions
What are the Top Zip Codes with the Highest Percentage of Population Employed in Architecture & Engineering in Houma, LA?
Top Zip Codes with the Highest Percentage of Population Employed in Architecture & Engineering in Houma, LA are:
What zip code has the Highest Percentage of Population Employed in Architecture & Engineering in Houma, LA?
70360 has the Highest Percentage of Population Employed in Architecture & Engineering in Houma, LA with 2.4%.
What is the Percentage of Population Employed in Architecture & Engineering in Houma, LA?
Percentage of Population Employed in Architecture & Engineering in Houma is 1.7%.
What is the Percentage of Population Employed in Architecture & Engineering in Louisiana?
Percentage of Population Employed in Architecture & Engineering in Louisiana is 1.9%.
What is the Percentage of Population Employed in Architecture & Engineering in the United States?
Percentage of Population Employed in Architecture & Engineering in the United States is 2.1%.