Zip Codes with the Highest Percentage of Population Employed in Architecture & Engineering in Hammond, LA
RELATED REPORTS & OPTIONS
Architecture & Engineering
Hammond
Compare Zip Codes
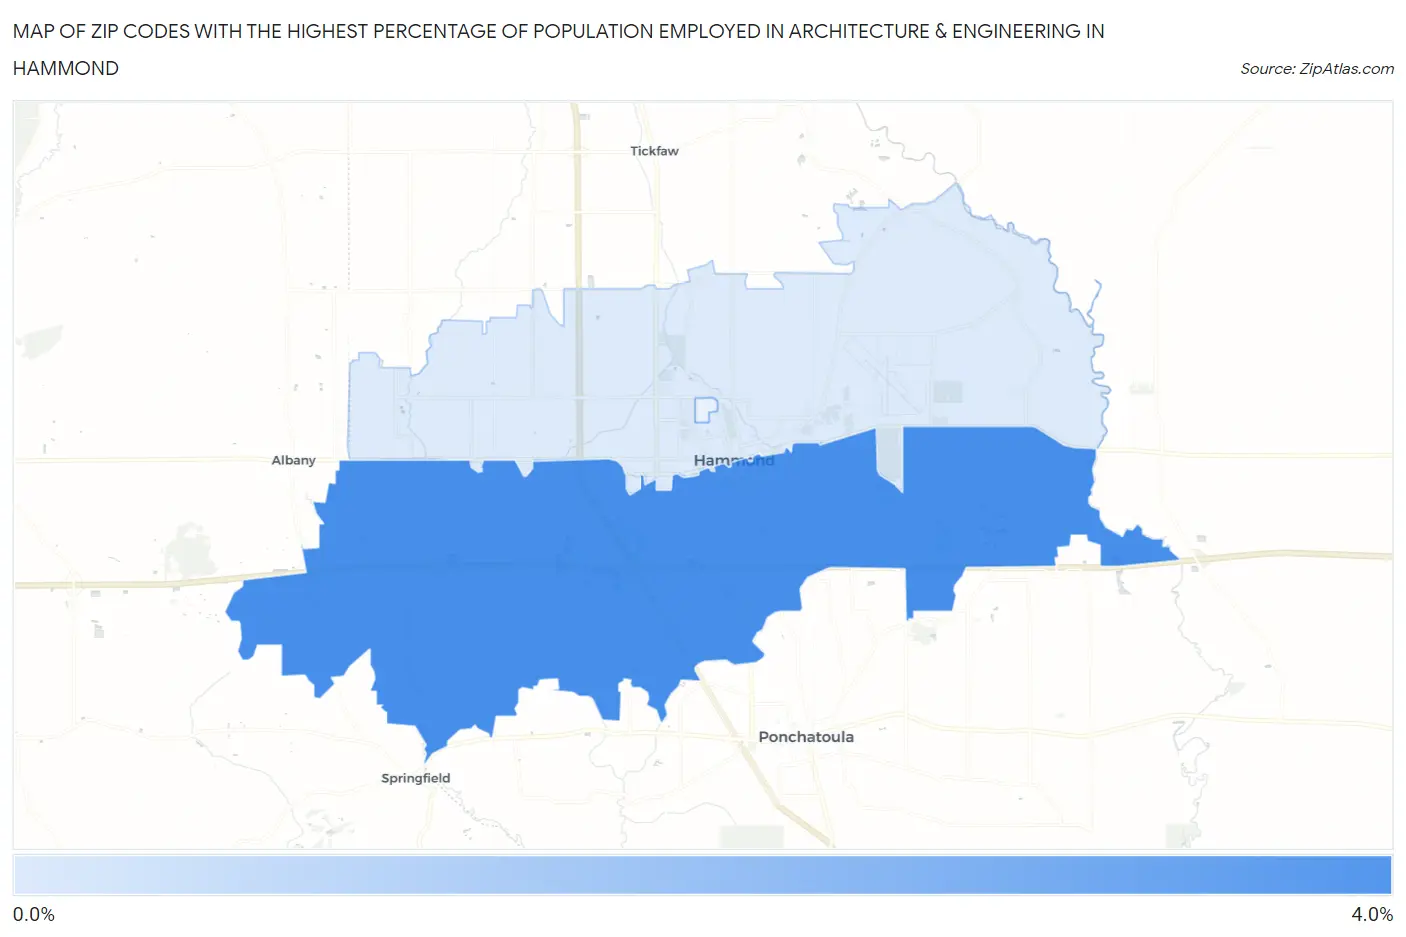
Map of Zip Codes with the Highest Percentage of Population Employed in Architecture & Engineering in Hammond
0.59%
3.5%
Zip Codes with the Highest Percentage of Population Employed in Architecture & Engineering in Hammond, LA
| Zip Code | % Employed | vs State | vs National | |
| 1. | 70403 | 3.5% | 1.9%(+1.60)#50 | 2.1%(+1.39)#3,641 |
| 2. | 70401 | 0.59% | 1.9%(-1.35)#264 | 2.1%(-1.56)#19,721 |
1
Common Questions
What are the Top Zip Codes with the Highest Percentage of Population Employed in Architecture & Engineering in Hammond, LA?
Top Zip Codes with the Highest Percentage of Population Employed in Architecture & Engineering in Hammond, LA are:
What zip code has the Highest Percentage of Population Employed in Architecture & Engineering in Hammond, LA?
70403 has the Highest Percentage of Population Employed in Architecture & Engineering in Hammond, LA with 3.5%.
What is the Percentage of Population Employed in Architecture & Engineering in Hammond, LA?
Percentage of Population Employed in Architecture & Engineering in Hammond is 2.6%.
What is the Percentage of Population Employed in Architecture & Engineering in Louisiana?
Percentage of Population Employed in Architecture & Engineering in Louisiana is 1.9%.
What is the Percentage of Population Employed in Architecture & Engineering in the United States?
Percentage of Population Employed in Architecture & Engineering in the United States is 2.1%.