Zip Codes with the Highest Percentage of Private Company Employees in Houma, LA
RELATED REPORTS & OPTIONS
Private Company Employees
Houma
Compare Zip Codes
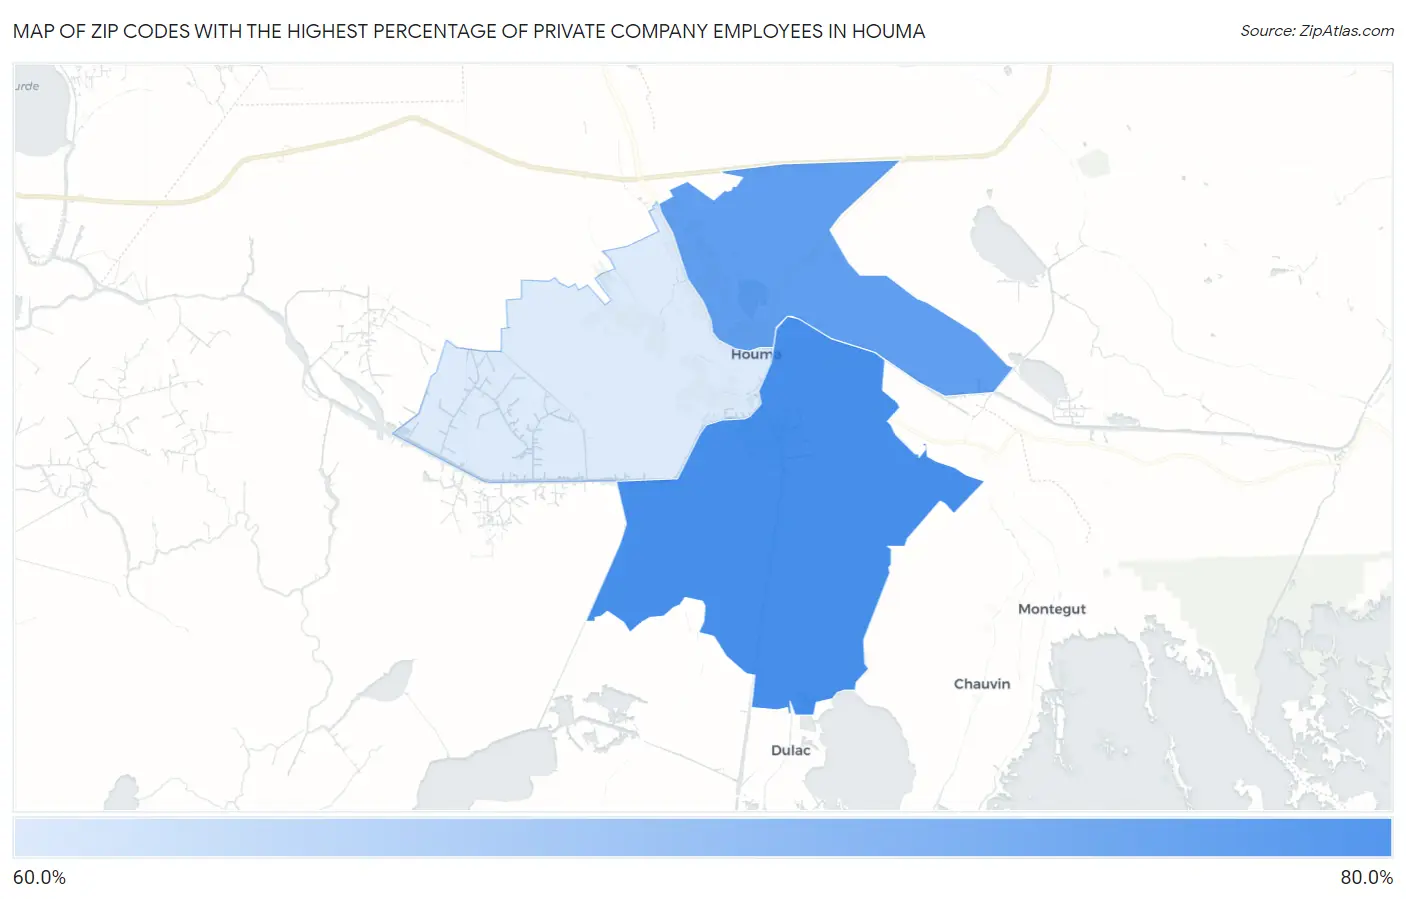
Map of Zip Codes with the Highest Percentage of Private Company Employees in Houma
69.7%
75.5%
Zip Codes with the Highest Percentage of Private Company Employees in Houma, LA
| Zip Code | % Private Company Employees | vs State | vs National | |
| 1. | 70363 | 75.5% | 66.4%(+9.05)#89 | 66.9%(+8.57)#4,540 |
| 2. | 70364 | 74.4% | 66.4%(+8.04)#100 | 66.9%(+7.56)#5,375 |
| 3. | 70360 | 69.7% | 66.4%(+3.25)#203 | 66.9%(+2.77)#10,806 |
1
Common Questions
What are the Top Zip Codes with the Highest Percentage of Private Company Employees in Houma, LA?
Top Zip Codes with the Highest Percentage of Private Company Employees in Houma, LA are:
What zip code has the Highest Percentage of Private Company Employees in Houma, LA?
70363 has the Highest Percentage of Private Company Employees in Houma, LA with 75.5%.
What is the Percentage of Private Company Employees in Houma, LA?
Percentage of Private Company Employees in Houma is 74.3%.
What is the Percentage of Private Company Employees in Louisiana?
Percentage of Private Company Employees in Louisiana is 66.4%.
What is the Percentage of Private Company Employees in the United States?
Percentage of Private Company Employees in the United States is 66.9%.